Turtles StrategyBorn from the 1980s "Turtle" experiment, this method of trading captures breakouts and places or closes trades with intrabar entries or exits and realized-equity risk controls.
How It Works
The strategy buys/sells on breakouts from recent highs/lows, using ATR for volatility-adjusted stops and sizing. It risks a fixed % (default 1%) of realized equity per trade—initial capital plus closed P&L, ignoring open positions for conservatism. Drawdown protection auto-reduces risk by 20% at 10% drops (up to three times), resetting only on full peak recovery. Single positions only, with 1-tick slippage simulated for realistic fills. Best for trending assets like forex,commodities, crypto, stocks. Backtest for optimal parameters.
Main Operations
The strategy works on any timeframe but it's meant to be used on daily charts.
Entry Signals:
Long: Buy-stop 1 tick above 20-bar high (default "Entry Period") when no position—enters intrabar on breakout.
Short: Sell-stop 1 tick below 20-bar low. OCA cancels opposites.
Size: (Realized equity × adjusted risk %) ÷ (2× ATR stop distance), scaled by point value.
Exit Signals:
Longs: Stop at tighter of (entry - 2× ATR) or (10-bar low - 1 tick trailing, default "Exit Period").
Shorts: Stop at tighter of (entry + 2× ATR) or (10-bar high + 1 tick trailing).
Locks profits in trends, exits fast on fades.
Risk Controls:
Tracks realized equity peak.
10% drawdown: Risk ×0.8; 20%/30%: Further ×0.8 (max 3x).
Full reset above peak—preserves capital in slumps.
Cari dalam skrip untuk "Buy sell"

Market Structure Volume ProfileThis indicator visualizes volume profiles that are dynamically anchored to market structure events, rather than fixed time intervals. It builds these profiles using high-resolution intra-bar data to provide a precise view of where value is established during critical market phases.
Key Features:
Event-Based Profile Anchoring: The indicator starts a new profile based on one of three user-selected events ('Profile Anchor'):
Swing: A new profile begins when the 'impulse baseline' (derived from intra-bar delta) changes. This baseline adjusts when a new price pivot is confirmed: When a price high forms, the baseline moves to the lower of its previous level or the peak delta (max of delta O/C) at the pivot. When a price low forms, it moves to the higher of its previous level or the trough delta (min of delta O/C) at the pivot.
Structure: A new profile begins immediately on the bar that confirms a market structure break (e.g., a new HH or LL, based on a sequence of price pivots).
Delta: A new profile begins immediately on the bar that confirms a break in the cumulative delta's market structure (e.g., a new HH or LL in the delta). Both 'Swing' and 'Delta' anchors are derived from the same continuous (non-resetting) Cumulative Volume Profile Delta (CVPD), which is built from the intra-bar statistical analysis.
Statistical Profile Engine: For each bar in the anchored period, the indicator builds a volume profile on a lower 'Intra-Bar Timeframe'. Instead of simple tick counting, it uses advanced statistical models:
Allocation ('Allot model'): 'PDF' (Probability Density Function) distributes volume proportionally across the bar's range based on an assumed statistical model (e.g., T4-Skew). 'Classic' assigns all volume to the close.
Buy/Sell Split ('Volume Estimator'): 'Dynamic' applies a model that analyzes candle wicks and recent trend to estimate buy/sell pressure. 'Classic' classifies all volume based on the candle color.
Visualization & Lag: The indicator plots the final profile (as a polygon) and the developing statistical lines (POC, VA, VWAP, StdDev).
Note on Lag: All anchor events require Pivot Right Bars for confirmation.
In 'Structure' and 'Delta' mode, the developing lines (POC, VA, etc.) are plotted using a non-repainting method (showing the value from pivRi bars ago).
In 'Swing' mode, the profile is plotted retroactively, starting from the bar where the pivot occurred. The developing lines are also plotted with this full pivRi lag to align with the past data.
Flexible Display Modes: The finalized profile can be displayed in three ways: 'Up/Down' (buy vs. sell), 'Total' (combined volume), and 'Delta' (net difference).
Dynamic Row Sizing: Includes an option ('Rows per Percent') to automatically adjust the number of profile rows (buckets) based on the profile's price range.
Integrated Alerts: Includes 13 alerts that trigger for:
A new profile reset ('Profile was resetted').
Price crossing any of the 6 developing levels (POC, VA High/Low, VWAP, StdDev High/Low).
Alert Lag Assumption: In 'Swing' mode, alerts are delayed to match the retroactively plotted lines. In 'Structure' and 'Delta' modes, alerts fire in real-time based on the current price crossing the current (repainting) value of the metric, which may differ from the non-repainting plotted line.
Caution: Real-Time Data Behavior (Intra-Bar Repainting) This indicator uses high-resolution intra-bar data. As a result, the values on the current, unclosed bar (the real-time bar) will update dynamically as new intra-bar data arrives. This includes the values used for real-time alerts in 'Structure' and 'Delta' modes.
DISCLAIMER
For Informational/Educational Use Only: This indicator is provided for informational and educational purposes only. It does not constitute financial, investment, or trading advice, nor is it a recommendation to buy or sell any asset.
Use at Your Own Risk: All trading decisions you make based on the information or signals generated by this indicator are made solely at your own risk.
No Guarantee of Performance: Past performance is not an indicator of future results. The author makes no guarantee regarding the accuracy of the signals or future profitability.
No Liability: The author shall not be held liable for any financial losses or damages incurred directly or indirectly from the use of this indicator.
Signals Are Not Recommendations: The alerts and visual signals (e.g., crossovers) generated by this tool are not direct recommendations to buy or sell. They are technical observations for your own analysis and consideration.

Periodic Volume ProfileThis indicator visualizes volume profiles that are dynamically anchored to market structure events, rather than fixed time intervals. It builds these profiles using high-resolution intra-bar data to provide a precise view of where value is established during critical market phases.
Key Features:
Event-Based Profile Anchoring: The indicator starts a new profile based on one of three user-selected events ('Profile Anchor'):
Swing: A new profile begins when the 'impulse baseline' (derived from delta) changes. This baseline adjusts when a new price pivot is confirmed: When a price high forms, the baseline moves to the lower of its previous level or the peak delta (max of delta O/C) at the pivot. When a price low forms, it moves to the higher of its previous level or the trough delta (min of delta O/C).
Structure: A new profile begins immediately on the bar that confirms a market structure break (e.g., a new HH or LL, based on a sequence of price pivots).
Delta: A new profile begins immediately on the bar that confirms a break in the cumulative delta's market structure (e.g., a new HH or LL in the delta).
Statistical Profile Engine: For each bar in the anchored period, the indicator builds a volume profile on a lower 'Intra-Bar Timeframe'. It uses:
Statistical Models ('Allot model'): Distributes volume across price levels using 'PDF' (Probability Density Function) or 'Classic' (close) methods.
Buy/Sell Classifiers ('Volume Estimator'): Splits volume using a 'Dynamic' (trend/wick-based) or 'Classic' (candle color) model.
Note on Anchor Lag: The different anchor types have different delays. 'Structure' and 'Delta' profiles begin in real-time on the confirmation bar. The 'Swing' profile calculation is plotted retroactively to the pivot's origin, as the pivot is only confirmed Pivot Right Bars after it occurs.
Flexible Visualization Modes: The finalized profile (plotted at the end of each period) can be displayed in three ways: 'Up/Down' (buy vs. sell), 'Total' (combined volume), and 'Delta' (net difference).
Developing Real-Time Metrics: The indicator plots the developing Point of Control (POC), Value Area (VA), VWAP, and Standard Deviation bands in real-time as the new profile forms.
Dynamic Row Sizing: Includes an option ('Rows per Percent') to automatically adjust the number of profile rows (buckets) based on the profile's price range, maintaining a consistent visual density.
Integrated Alerts: Includes 13 alerts that trigger for:
A new profile reset ('Profile was resetted').
Price crossing any of the 6 developing levels (POC, VA High/Low, VWAP, StdDev High/Low).
Caution: Real-Time Data Behavior (Intra-Bar Repainting) This indicator uses high-resolution intra-bar data. As a result, the values on the current, unclosed bar (the real-time bar) will update dynamically as new intra-bar data arrives. This behavior is normal and necessary for this type of analysis. Signals should only be considered final after the main chart bar has closed.
DISCLAIMER
For Informational/Educational Use Only: This indicator is provided for informational and educational purposes only. It does not constitute financial, investment, or trading advice, nor is it a recommendation to buy or sell any asset.
Use at Your Own Risk: All trading decisions you make based on the information or signals generated by this indicator are made solely at your own risk.
No Guarantee of Performance: Past performance is not an indicator of future results. The author makes no guarantee regarding the accuracy of the signals or future profitability.
No Liability: The author shall not be held liable for any financial losses or damages incurred directly or indirectly from the use of this indicator.
Signals Are Not Recommendations: The alerts and visual signals (e.g., crossovers) generated by this tool are not direct recommendations to buy or sell. They are technical observations for your own analysis and consideration.

Pivot Orderflow DeltaThis indicator analyzes order flow by calculating a continuous Cumulative Volume Profile Delta (CVPD). It plots this delta as a series of "delta candles" and identifies divergences and structural pivot levels.
Key Features:
Statistical Delta Engine: For each bar, the indicator builds a high-resolution volume profile on a lower 'Intra-Bar Timeframe'. It uses statistical models ('PDF' allocation) and advanced classifiers ('Dynamic' split) to determine the buy/sell pressure, which is then accumulated.
Cumulative Delta Candle Visualization: The indicator plots the continuous, accumulated delta as a series of candles, where for each bar:
Open: Is the cumulative delta value of the previous bar.
Close: Is the new total cumulative delta.
High/Low: Represent the peak/trough cumulative delta reached during that bar's formation.
Dynamic Pivot Baseline: The indicator plots a separate dynamic baseline ('Impulse Start') that adjusts when a new price pivot is confirmed.
When a price high forms, the baseline moves to the lower of its previous level or the peak delta (max of delta candle O/C) at the pivot.
When a price low forms, the baseline moves to the higher of its previous level or the trough delta (min of delta candle O/C) at the pivot.
Full Divergence Suite (Class A, B, C): A built-in divergence engine automatically detects and plots Regular (A), Hidden (B), and Exaggerated (C) divergences between price and the peak/trough of the delta candles (High/Low).
Detailed Pivot Confluence: The indicator plots distinct markers to differentiate between pivots occurring only on the price chart, only on the delta oscillator, or on both simultaneously.
Note on Confirmation (Lag): Divergence and pivot signals rely on a confirmation method. A pivot is only plotted after the Pivot Right Bars input has passed, which introduces an inherent lag.
Integrated Alerts: Includes 23 comprehensive alerts for:
The start and end of all 6 divergence types.
The detection of a new Impulse Start pivot.
Delta/volume agreement/disagreement.
Delta crossing the zero line.
The formation of price-only or delta-only pivots.
Caution: Real-Time Data Behavior (Intra-Bar Repainting) This indicator uses high-resolution intra-bar data. As a result, the values on the current, unclosed bar (the real-time bar) will update dynamically as new intra-bar data arrives. This behavior is normal and necessary for this type of analysis. Signals should only be considered final after the main chart bar has closed.
DISCLAIMER
For Informational/Educational Use Only: This indicator is provided for informational and educational purposes only. It does not constitute financial, investment, or trading advice, nor is it a recommendation to buy or sell any asset.
Use at Your Own Risk: All trading decisions you make based on the information or signals generated by this indicator are made solely at your own risk.
No Guarantee of Performance: Past performance is not an indicator of future results. The author makes no guarantee regarding the accuracy of the signals or future profitability.
No Liability: The author shall not be held liable for any financial losses or damages incurred directly or indirectly from the use of this indicator.
Signals Are Not Recommendations: The alerts and visual signals (e.g., crossovers) generated by this tool are not direct recommendations to buy or sell. They are technical observations for your own analysis and consideration.

LibVPrfLibrary "LibVPrf"
This library provides an object-oriented framework for volume
profile analysis in Pine Script®. It is built around the `VProf`
User-Defined Type (UDT), which encapsulates all data, settings,
and statistical metrics for a single profile, enabling stateful
analysis with on-demand calculations.
Key Features:
1. **Object-Oriented Design (UDT):** The library is built around
the `VProf` UDT. This object encapsulates all profile data
and provides methods for its full lifecycle management,
including creation, cloning, clearing, and merging of profiles.
2. **Volume Allocation (`AllotMode`):** Offers two methods for
allocating a bar's volume:
- **Classic:** Assigns the entire bar's volume to the close
price bucket.
- **PDF:** Distributes volume across the bar's range using a
statistical price distribution model from the `LibBrSt` library.
3. **Buy/Sell Volume Splitting (`SplitMode`):** Provides methods
for classifying volume into buying and selling pressure:
- **Classic:** Classifies volume based on the bar's color (Close vs. Open).
- **Dynamic:** A specific model that analyzes candle structure
(body vs. wicks) and a short-term trend factor to
estimate the buy/sell share at each price level.
4. **Statistical Analysis (On-Demand):** Offers a suite of
statistical metrics calculated using a "Lazy Evaluation"
pattern (computed only when requested via `get...` methods):
- **Central Tendency:** Point of Control (POC), VWAP, and Median.
- **Dispersion:** Value Area (VA) and Population Standard Deviation.
- **Shape:** Skewness and Excess Kurtosis.
- **Delta:** Cumulative Volume Delta, including its
historical high/low watermarks.
5. **Structural Analysis:** Includes a parameter-free method
(`getSegments`) to decompose a profile into its fundamental
unimodal segments, allowing for modality detection (e.g.,
identifying bimodal profiles).
6. **Dynamic Profile Management:**
- **Auto-Fitting:** Profiles set to `dynamic = true` will
automatically expand their price range to fit new data.
- **Manipulation:** The resolution, price range, and Value Area
of a dynamic profile can be changed at any time. This
triggers a resampling process that uses a **linear
interpolation model** to re-bucket existing volume.
- **Assumption:** Non-dynamic profiles are fixed and will throw
a `runtime.error` if `addBar` is called with data
outside their initial range.
7. **Bucket-Level Access:** Provides getter methods for direct
iteration and analysis of the raw buy/sell volume and price
boundaries of each individual price bucket.
---
**DISCLAIMER**
This library is provided "AS IS" and for informational and
educational purposes only. It does not constitute financial,
investment, or trading advice.
The author assumes no liability for any errors, inaccuracies,
or omissions in the code. Using this library to build
trading indicators or strategies is entirely at your own risk.
As a developer using this library, you are solely responsible
for the rigorous testing, validation, and performance of any
scripts you create based on these functions. The author shall
not be held liable for any financial losses incurred directly
or indirectly from the use of this library or any scripts
derived from it.
create(buckets, rangeUp, rangeLo, dynamic, valueArea, allot, estimator, cdfSteps, split, trendLen)
Construct a new `VProf` object with fixed bucket count & range.
Parameters:
buckets (int) : series int number of price buckets ≥ 1
rangeUp (float) : series float upper price bound (absolute)
rangeLo (float) : series float lower price bound (absolute)
dynamic (bool) : series bool Flag for dynamic adaption of profile ranges
valueArea (int) : series int Percentage of total volume to include in the Value Area (1..100)
allot (series AllotMode) : series AllotMode Allocation mode `classic` or `pdf` (default `classic`)
estimator (series PriceEst enum from AustrianTradingMachine/LibBrSt/1) : series LibBrSt.PriceEst PDF model when `model == PDF`. (deflault = 'uniform')
cdfSteps (int) : series int even #sub-intervals for Simpson rule (default 20)
split (series SplitMode) : series SplitMode Buy/Sell determination (default `classic`)
trendLen (int) : series int Look‑back bars for trend factor (default 3)
Returns: VProf freshly initialised profile
method clone(self)
Create a deep copy of the volume profile.
Namespace types: VProf
Parameters:
self (VProf) : VProf Profile object to copy
Returns: VProf A new, independent copy of the profile
method clear(self)
Reset all bucket tallies while keeping configuration intact.
Namespace types: VProf
Parameters:
self (VProf) : VProf profile object
Returns: VProf cleared profile (chaining)
method merge(self, srcABuy, srcASell, srcRangeUp, srcRangeLo, srcCvd, srcCvdHi, srcCvdLo)
Merges volume data from a source profile into the current profile.
If resizing is needed, it performs a high-fidelity re-bucketing of existing
volume using a linear interpolation model inferred from neighboring buckets,
preventing aliasing artifacts and ensuring accurate volume preservation.
Namespace types: VProf
Parameters:
self (VProf) : VProf The target profile object to merge into.
srcABuy (array) : array The source profile's buy volume bucket array.
srcASell (array) : array The source profile's sell volume bucket array.
srcRangeUp (float) : series float The upper price bound of the source profile.
srcRangeLo (float) : series float The lower price bound of the source profile.
srcCvd (float) : series float The final Cumulative Volume Delta (CVD) value of the source profile.
srcCvdHi (float) : series float The historical high-water mark of the CVD from the source profile.
srcCvdLo (float) : series float The historical low-water mark of the CVD from the source profile.
Returns: VProf `self` (chaining), now containing the merged data.
method addBar(self, offset)
Add current bar’s volume to the profile (call once per realtime bar).
classic mode: allocates all volume to the close bucket and classifies
by `close >= open`. PDF mode: distributes volume across buckets by the
estimator’s CDF mass. For `split = dynamic`, the buy/sell share per
price is computed via context-driven piecewise s(u).
Namespace types: VProf
Parameters:
self (VProf) : VProf Profile object
offset (int) : series int To offset the calculated bar
Returns: VProf `self` (method chaining)
method setBuckets(self, buckets)
Sets the number of buckets for the volume profile.
Behavior depends on the `isDynamic` flag.
- If `dynamic = true`: Works on filled profiles by re-bucketing to a new resolution.
- If `dynamic = false`: Only works on empty profiles to prevent accidental changes.
Namespace types: VProf
Parameters:
self (VProf) : VProf Profile object
buckets (int) : series int The new number of buckets
Returns: VProf `self` (chaining)
method setRanges(self, rangeUp, rangeLo)
Sets the price range for the volume profile.
Behavior depends on the `dynamic` flag.
- If `dynamic = true`: Works on filled profiles by re-bucketing existing volume.
- If `dynamic = false`: Only works on empty profiles to prevent accidental changes.
Namespace types: VProf
Parameters:
self (VProf) : VProf Profile object
rangeUp (float) : series float The new upper price bound
rangeLo (float) : series float The new lower price bound
Returns: VProf `self` (chaining)
method setValueArea(self, valueArea)
Set the percentage of volume for the Value Area. If the value
changes, the profile is finalized again.
Namespace types: VProf
Parameters:
self (VProf) : VProf Profile object
valueArea (int) : series int The new Value Area percentage (0..100)
Returns: VProf `self` (chaining)
method getBktBuyVol(self, idx)
Get Buy volume of a bucket.
Namespace types: VProf
Parameters:
self (VProf) : VProf Profile object
idx (int) : series int Bucket index
Returns: series float Buy volume ≥ 0
method getBktSellVol(self, idx)
Get Sell volume of a bucket.
Namespace types: VProf
Parameters:
self (VProf) : VProf Profile object
idx (int) : series int Bucket index
Returns: series float Sell volume ≥ 0
method getBktBnds(self, idx)
Get Bounds of a bucket.
Namespace types: VProf
Parameters:
self (VProf) : VProf Profile object
idx (int) : series int Bucket index
Returns:
up series float The upper price bound of the bucket.
lo series float The lower price bound of the bucket.
method getPoc(self)
Get POC information.
Namespace types: VProf
Parameters:
self (VProf) : VProf Profile object
Returns:
pocIndex series int The index of the Point of Control (POC) bucket.
pocPrice. series float The mid-price of the Point of Control (POC) bucket.
method getVA(self)
Get Value Area (VA) information.
Namespace types: VProf
Parameters:
self (VProf) : VProf Profile object
Returns:
vaUpIndex series int The index of the upper bound bucket of the Value Area.
vaUpPrice series float The upper price bound of the Value Area.
vaLoIndex series int The index of the lower bound bucket of the Value Area.
vaLoPrice series float The lower price bound of the Value Area.
method getMedian(self)
Get the profile's median price and its bucket index. Calculates the value on-demand if stale.
Namespace types: VProf
Parameters:
self (VProf) : VProf Profile object.
Returns:
medianIndex series int The index of the bucket containing the Median.
medianPrice series float The Median price of the profile.
method getVwap(self)
Get the profile's VWAP and its bucket index. Calculates the value on-demand if stale.
Namespace types: VProf
Parameters:
self (VProf) : VProf Profile object.
Returns:
vwapIndex series int The index of the bucket containing the VWAP.
vwapPrice series float The Volume Weighted Average Price of the profile.
method getStdDev(self)
Get the profile's volume-weighted standard deviation. Calculates the value on-demand if stale.
Namespace types: VProf
Parameters:
self (VProf) : VProf Profile object.
Returns: series float The Standard deviation of the profile.
method getSkewness(self)
Get the profile's skewness. Calculates the value on-demand if stale.
Namespace types: VProf
Parameters:
self (VProf) : VProf Profile object.
Returns: series float The Skewness of the profile.
method getKurtosis(self)
Get the profile's excess kurtosis. Calculates the value on-demand if stale.
Namespace types: VProf
Parameters:
self (VProf) : VProf Profile object.
Returns: series float The Kurtosis of the profile.
method getSegments(self)
Get the profile's fundamental unimodal segments. Calculates on-demand if stale.
Uses a parameter-free, pivot-based recursive algorithm.
Namespace types: VProf
Parameters:
self (VProf) : VProf The profile object.
Returns: matrix A 2-column matrix where each row is an pair.
method getCvd(self)
Cumulative Volume Delta (CVD) like metric over all buckets.
Namespace types: VProf
Parameters:
self (VProf) : VProf Profile object.
Returns:
cvd series float The final Cumulative Volume Delta (Total Buy Vol - Total Sell Vol).
cvdHi series float The running high-water mark of the CVD as volume was added.
cvdLo series float The running low-water mark of the CVD as volume was added.
VProf
VProf Bucketed Buy/Sell volume profile plus meta information.
Fields:
buckets (series int) : int Number of price buckets (granularity ≥1)
rangeUp (series float) : float Upper price range (absolute)
rangeLo (series float) : float Lower price range (absolute)
dynamic (series bool) : bool Flag for dynamic adaption of profile ranges
valueArea (series int) : int Percentage of total volume to include in the Value Area (1..100)
allot (series AllotMode) : AllotMode Allocation mode `classic` or `pdf`
estimator (series PriceEst enum from AustrianTradingMachine/LibBrSt/1) : LibBrSt.PriceEst Price density model when `model == PDF`
cdfSteps (series int) : int Simpson integration resolution (even ≥2)
split (series SplitMode) : SplitMode Buy/Sell split strategy per bar
trendLen (series int) : int Look‑back length for trend factor (≥1)
maxBkt (series int) : int User-defined number of buckets (unclamped)
aBuy (array) : array Buy volume per bucket
aSell (array) : array Sell volume per bucket
cvd (series float) : float Final Cumulative Volume Delta (Total Buy Vol - Total Sell Vol).
cvdHi (series float) : float Running high-water mark of the CVD as volume was added.
cvdLo (series float) : float Running low-water mark of the CVD as volume was added.
poc (series int) : int Index of max‑volume bucket (POC). Is `na` until calculated.
vaUp (series int) : int Index of upper Value‑Area bound. Is `na` until calculated.
vaLo (series int) : int Index of lower value‑Area bound. Is `na` until calculated.
median (series float) : float Median price of the volume distribution. Is `na` until calculated.
vwap (series float) : float Profile VWAP (Volume Weighted Average Price). Is `na` until calculated.
stdDev (series float) : float Standard Deviation of volume around the VWAP. Is `na` until calculated.
skewness (series float) : float Skewness of the volume distribution. Is `na` until calculated.
kurtosis (series float) : float Excess Kurtosis of the volume distribution. Is `na` until calculated.
segments (matrix) : matrix A 2-column matrix where each row is an pair. Is `na` until calculated.

Liquidity Grab + RSI Divergence═══════════════════════════════════════════════════════════════
LIQUIDITY GRAB + RSI DIVERGENCE INDICATOR
═══════════════════════════════════════════════════════════════
📌 OVERVIEW
This indicator identifies high-probability reversals by combining:
• Liquidity sweeps (stop hunts)
• RSI divergence confirmation
• Filters false breakouts automatically
═══════════════════════════════════════════════════════════════
🟢 BUY SIGNAL (Green Triangle Up)
REQUIRES BOTH CONDITIONS:
1. Liquidity Grab Below Previous Low
• Price breaks BELOW recent low
• Candle CLOSES ABOVE that low
• Traps sellers who shorted the breakdown
2. Bullish RSI Divergence
• Price: Lower Low (LL)
• RSI: Higher Low (HL)
• Shows weakening downward momentum
➜ Result: Potential bullish reversal
═══════════════════════════════════════════════════════════════
🔴 SELL SIGNAL (Red Triangle Down)
REQUIRES BOTH CONDITIONS:
1. Liquidity Grab Above Previous High
• Price breaks ABOVE recent high
• Candle CLOSES BELOW that high
• Traps buyers who bought the breakout
2. Bearish RSI Divergence
• Price: Higher High (HH)
• RSI: Lower High (LH)
• Shows weakening upward momentum
➜ Result: Potential bearish reversal
═══════════════════════════════════════════════════════════════
📊 VISUAL INDICATORS
Main Signals:
🔺 Large Green Triangle = BUY (Liq Grab + Bullish Div)
🔻 Large Red Triangle = SELL (Liq Grab + Bearish Div)
Reference Levels:
━ Red Line = Previous High Level
━ Green Line = Previous Low Level
Additional Markers (Optional):
○ Small Green Circle = Liquidity grab low only
○ Small Red Circle = Liquidity grab high only
✕ Small Blue Cross = Bullish divergence only
✕ Small Orange Cross = Bearish divergence only
═══════════════════════════════════════════════════════════════
⚙️ SETTINGS
1. Lookback Period (Default: 20)
• Range: 5-100
• Sets how far back to identify previous highs/lows
• Higher = fewer but stronger levels
• Lower = more frequent but weaker levels
2. RSI Length (Default: 14)
• Range: 5-50
• Standard RSI calculation period
• 14 is industry standard
3. RSI Divergence Lookback (Default: 5)
• Range: 3-20
• Controls pivot point sensitivity
• Higher = fewer divergence signals
• Lower = more divergence signals
4. Show Labels (Default: ON)
• Toggle BUY/SELL text labels
• Disable for cleaner chart view
═══════════════════════════════════════════════════════════════
💡 HOW TO USE
Step 1: WAIT FOR CONFIRMATION
• Only trade LARGE TRIANGLE signals
• Ignore small circles/crosses alone
Step 2: CHECK TIMEFRAME
• Best on: 15min, 1H, 4H, Daily
• Avoid: 1min, 5min (too noisy)
Step 3: CONFIRM CONTEXT
• Check overall market trend
• Identify key support/resistance
• Look for confluence with price action
Step 4: ENTRY & RISK MANAGEMENT
• Enter on signal candle close or pullback
• Stop loss below/above the liquidity grab wick
• Target: Previous swing high/low or key levels
• Risk/Reward: Minimum 1:2 ratio
Step 5: SET ALERTS
• Create alert for "BUY Signal"
• Create alert for "SELL Signal"
• Never miss opportunities
═══════════════════════════════════════════════════════════════
✅ BEST PRACTICES
DO:
✓ Use on multiple timeframes for confluence
✓ Combine with support/resistance zones
✓ Wait for both conditions (liq grab + divergence)
✓ Practice on demo account first
✓ Use proper position sizing
DON'T:
✗ Trade every small circle/cross
✗ Use on very low timeframes (<15min)
✗ Ignore overall market context
✗ Trade without stop loss
✗ Risk more than 1-2% per trade
═══════════════════════════════════════════════════════════════
⚠️ IMPORTANT NOTES
• This is a CONFIRMATION tool, not a holy grail
• No indicator is 100% accurate
• Combine with your trading strategy
• Backtest on your preferred instruments
• Adjust parameters for your trading style
• Higher timeframes = more reliable signals
• Always use risk management
═══════════════════════════════════════════════════════════════
🔔 ALERTS INCLUDED
Two alert conditions are built-in:
1. "BUY Signal" - Liquidity Grab + Bullish RSI Divergence
2. "SELL Signal" - Liquidity Grab + Bearish RSI Divergence
═══════════════════════════════════════════════════════════════
📈 RECOMMENDED SETTINGS BY TIMEFRAME
5-15 Min Charts:
• Lookback: 10-15
• RSI Length: 14
• RSI Div Lookback: 3-5
1H-4H Charts:
• Lookback: 20-30
• RSI Length: 14
• RSI Div Lookback: 5-7
Daily Charts:
• Lookback: 30-50
• RSI Length: 14
• RSI Div Lookback: 7-10
═══════════════════════════════════════════════════════════════
Good luck and trade safe! 🚀

WAD : Whale Activity Detector🐋 WAD: Whale Activity Detector
WAD (Whale Activity Detector) automatically detects periods of abnormally high trading volume compared to the average, identifying potential whale (institutional) buy or sell activity and visualizing it directly on the chart.
🔍 How It Works
1. Buy/Sell Volume Separation
Each candle’s trading volume is categorized based on its direction:
Bullish candle → Buy volume
Bearish candle → Sell volume
This separation helps distinguish the actual strength of buying vs. selling pressure, rather than looking at total volume alone.
2. Average Volume Calculation
Over a user-defined lookback period (default: 34 bars), the indicator calculates the moving average of both buy and sell volumes, establishing a baseline for what constitutes “normal” activity.
3. Whale Activity Detection
When the current volume exceeds n times the average volume (default: 4×), the indicator flags it as a Whale Zone — a potential sign of large player involvement.
Volume surge on a bullish candle → Whale Buy
Volume surge on a bearish candle → Whale Sell
4. Visual Display
🟢 Green bars: Whale buy activity
🔴 Red bars: Whale sell activity
BUY/SELL labels: Appear above the chart when an anomaly is detected
Average line toggle: Users can turn the average volume lines on or off for clarity
5. Alerts
Whenever whale buy/sell signals are detected, real-time alerts are triggered.
Example: 🐋 Whale Buy – NVDA! 🟢
⚙️ Indicator Meaning
Rather than showing raw volume, WAD tracks “abnormal volume relative to the average.”
It filters out noise and highlights the moments where large entities begin to move.
Essentially, it visualizes intentional and impactful trades hidden within standard volume activity.
🚀 Example Use Cases
Whale accumulation tracking – Repeated strong buy signals may indicate sustained institutional accumulation.
Short-term breakout confirmation – Price often rallies shortly after whale buy signals appear.
Support/resistance analysis – Whale sell zones frequently align with short-term resistance areas.
In short:
WAD identifies when trading volume exceeds its historical norm to highlight where big money enters or exits the market.
===============================================================================
🐋 WAD : 세력 매매거래 추적기
WAD(Whale Activity Detector) 는 특정 종목의 거래량 패턴 속에서
‘평균 대비 비정상적으로 큰 거래량이 발생한 구간’을 자동으로 감지해
세력(Whale)의 매수·매도 활동을 시각화하는 지표입니다.
🔍 작동 원리
매수·매도 거래량 분리
각 캔들이 양봉인지, 음봉인지에 따라 거래량을 분리합니다.
양봉 시 발생한 거래량 → 매수 거래량(buy volume)
음봉 시 발생한 거래량 → 매도 거래량(sell volume)
이렇게 분리함으로써 단순 거래량이 아닌,
실제 매수세/매도세의 힘을 구분할 수 있습니다.
평균 거래량 계산
사용자가 지정한 기간(기본 34봉)을 기준으로
매수·매도 거래량의 이동평균선을 각각 계산합니다.
이는 ‘정상적인 거래량 수준’을 판단하는 기준선으로 활용됩니다.
이상치 탐지 (Whale Activity Detection)
현재 거래량이 평균 거래량의 n배(기본 4배)를 초과할 경우,
그 구간을 세력 개입 구간(Whale Zone) 으로 판단합니다.
양봉에서 급증 → 세력 매수 (Whale Buy)
음봉에서 급증 → 세력 매도 (Whale Sell)
시각적 표시
초록색 기둥 : 세력 매수 거래량
빨간색 기둥 : 세력 매도 거래량
라벨 표시 (BUY / SELL) : 이상치 발생 시 차트 상단에 표시
평균선 표시 옵션 : 사용자가 원할 때 평균선을 켜거나 끌 수 있음
알림(Alerts)
세력의 매수·매도 신호가 감지되면,
알림 메시지를 통해 실시간으로 통보받을 수 있습니다.
(예: 🐋 Whale Buy - NVDA! 🟢)
⚙️ 지표의 의미
단순 거래량이 아니라, ‘평균 대비 비정상적 거래량’ 을 추적합니다.
즉, “세력이 본격적으로 움직이기 시작한 구간” 만 걸러내는 지표입니다.
노이즈가 많은 거래량 차트 속에서 의도 있는 거래의 흔적을 포착할 수 있습니다.
🚀 활용 예시
세력 매집 구간 포착 : 큰 매수 시그널이 반복적으로 발생하는 구간은 세력의 누적 매집 가능성을 의미함
단기 급등 신호 확인 : 매수 이상치가 발생한 직후 가격이 급등하는 경우가 많음
지지/저항 분석과 병행 활용 : 세력 매도 구간은 단기 저항으로 작용하는 경향이 있음
copyright @invest_hedgeway

Institutional Compression Breakout (ICBO Algo) [@darshakssc]The ICBO Algo is a smart intraday trading tool that detects institutional compression zones followed by breakout confirmation. It combines candle range analysis, volume compression, EMA filtering, and ATR-based Risk/Reward zones to highlight high-probability trade setups with visual clarity.
This script is designed for educational and research purposes only, fully aligned with TradingView’s Pine Script policy and publishing guidelines.
🔍 Key Features
🌀 Compression Zone Detection
Identifies low-range, low-volume candles often formed before institutional breakouts.
📈📉 Breakout Signals
Triggered after confirmed price + EMA breakout post-compression.
📊 Dashboard Panel
Displays breakout phase, current R:R ratio, and zone status in real-time.
🟢🔴 Buy/Sell Labels with Emojis
Clean and non-intrusive labels for immediate action recognition.
🔔 Alerts Included
Receive real-time push, email, or webhook alerts for breakout signals.
⚙️ How It Works
Compression Phase:
When the candle range and volume are significantly lower than the moving average, the script flags it as a compression zone.
Breakout Confirmation:
A breakout signal is confirmed when the price breaks the previous high/low and is above/below the trend EMA.
Entry Logic:
📈 Buy: Price > previous high + above EMA after compression
📉 Sell: Price < previous low + below EMA after compression
⚠️ Disclaimer
This script is intended for educational and research purposes only. It does not constitute financial advice or recommendations of any kind. Always use proper risk management. Past performance does not guarantee future results.

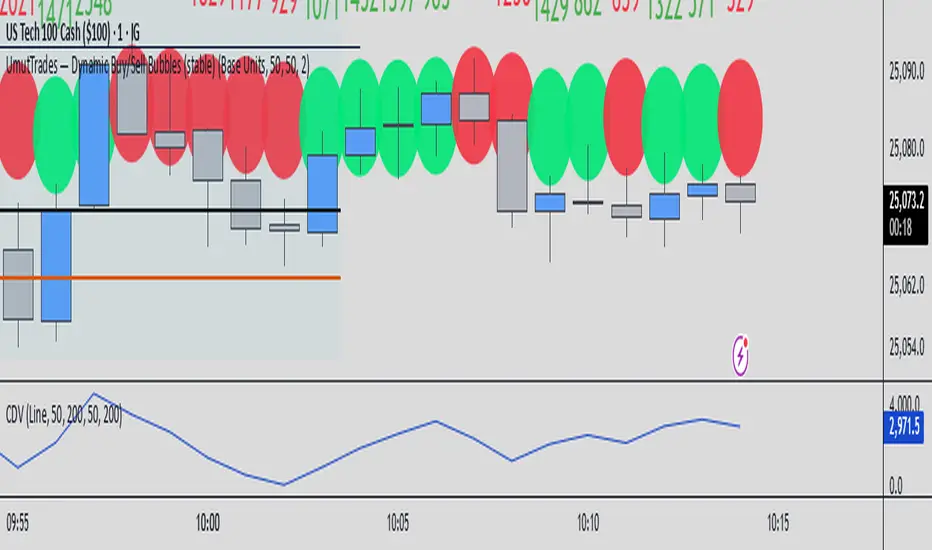
UmutTrades — Dynamic Buy/Sell Bubbles (stable)This indicator detects large buy and sell transactions based on user-defined thresholds (either in base units or quote value).
It places colored bubbles on the chart where those big orders occur green for buys and red for sells with the bubble’s color intensity and size reflecting how large the order is relative to your threshold.
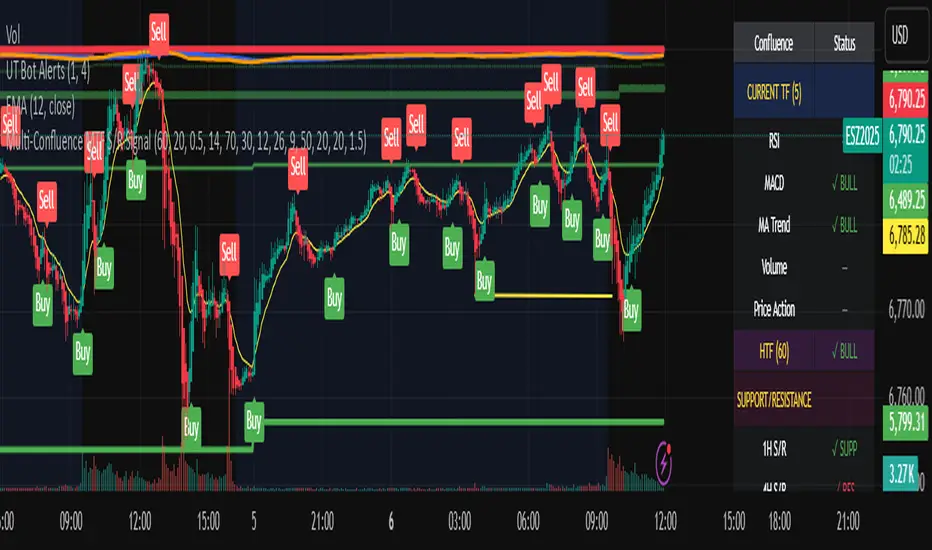
Multi-Confluence MTF S/R Signal5 Confluences:
RSI - Detects oversold/overbought conditions with momentum
MACD - Confirms trend direction and momentum shifts
Moving Average Trend - Validates price position relative to 50 SMA and 20 EMA
Volume - Ensures strong participation (1.5x average volume)
Price Action - Confirms breakout (higher high for buys, lower low for sells)
Features:
Green triangles below bars = BUY signal (all 5 confluences bullish)
Red triangles above bars = SELL signal (all 5 confluences bearish)
Background coloring when signals occur
Real-time dashboard showing each confluence status
Built-in alerts you can enable
Customizable parameters for all indicators
Multi-Timeframe Features:
Higher Timeframe Analysis (Default: 60 min)
HTF Trend - Checks if price is above/below moving averages on higher timeframe
HTF MACD - Confirms momentum direction
HTF RSI - Validates not overbought/oversold
Signal Types:
Strong Signals (Full triangles with text)
✅ All 5 current timeframe confluences aligned
✅ Higher timeframe confirmation (2 of 3 HTF conditions)
GREEN "BUY" or RED "SELL" labels
Weak Signals (Small transparent triangles with "?")
✅ All 5 current timeframe confluences aligned
❌ NO higher timeframe confirmation
Use with caution - may signal counter-trend trades
Dashboard Updates:
Shows Current Timeframe section (all 5 confluences)
Shows HTF status (your chosen higher timeframe)
Displays final signal strength
Customizable Settings:
Enable/Disable MTF - Toggle multi-timeframe confirmation
Higher Timeframe - Choose any timeframe (15m, 60m, 4H, D, etc.)
Require HTF - Force HTF confirmation or allow weak signals
Alerts:
Strong Buy/Sell - Full confirmation
Weak Buy/Sell - No HTF confirmation
Multi-Timeframe MACD with Color Mix (Nikko)Multi-Timeframe MACD with Color Mix (Nikko) Indicator
This documentation explains the benefits of the "Multi-Timeframe MACD with Color Mix (Nikko)" indicator for traders and provides easy-to-follow steps on how to use it. Written as of 05:06 AM +07 on Saturday, October 04, 2025, this guide focuses on helping you, as a trader, get the most out of this tool with clear, practical advice before diving into the technical details.
Benefits for Traders
1. Multi-Timeframe Insight
This indicator lets you see momentum trends across 15-minute, 1-hour, 1-day, and 1-week timeframes all on one chart. This big-picture view helps you catch both quick market moves and long-term trends without flipping between charts, saving you time and giving you a fuller understanding of the market.
2. Visual Momentum Representation
The background changes from red to green based on short-term (15m) momentum, giving you a quick, easy-to-see signal—red means bearish (prices might drop), and green means bullish (prices might rise). The histogram uses a mix of red, green, and blue colors to show the combined strength of the 1-hour, 1-day, and 1-week timeframes, helping you spot strong trends at a glance (e.g., a bright mix for strong momentum, darker for weaker).
3. Enhanced Decision-Making
The background and histogram colors work together to confirm trends across different timeframes, making it less likely you’ll act on a false signal. This helps you feel more confident when deciding when to buy, sell, or hold.
4. Proactive Alert System
You can set alerts to notify you when the percentage of bullish timeframes hits your chosen levels (e.g., below 10% for bearish, above 90% for bullish). This keeps you in the loop on big momentum shifts without needing to watch the chart all day—perfect for when you’re busy.
5. Flexibility and Efficiency
You can turn timeframes on or off, adjust settings like speed of the moving averages, and tweak transparency to fit your trading style—whether you’re a fast scalper or a patient swing trader. Everything is shown on one chart, saving you effort, and the colors make it simple to read, even if you’re new to trading.
How to Use It
Getting Started
Add the Indicator: Load the "Multi-Timeframe MACD with Color Mix (Nikko)" onto your TradingView chart using the Pine Script editor or indicator library.
Pick Your Timeframes: Turn on the timeframes that match your trading—use 15m and 1h for quick trades, or 1d and 1w for longer holds—using the enable_15m, enable_1h, enable_1d, enable_1w, and enable_background options.
Reading the Colors
Background Gradient: Watch for red to signal bearish 15m momentum and green for bullish momentum. Adjust the Background_transparency (default 75%, or 25% opacity) if the chart feels too busy—try lowering it to 50 for clearer candlesticks in fast markets.
Histogram and EMA Colors:
The histogram and its Exponential Moving Average (EMA) line show a mix of red (1-week), green (1-day), and blue (1-hour) based on how strong the momentum is in each timeframe.
Brighter colors mean stronger momentum—white (all bright) shows all timeframes are pushing up hard, while darker shades (like gray or black) mean weaker or mixed momentum.
Turn off a timeframe (e.g., enable_1h = false) to see how it changes the color mix and focus on what matters to you.
Setting Alerts
Set Your Levels: Choose a threshold_low (default 10%) and threshold_high (default 90%) based on your comfort zone or past market patterns to catch big turns.
Get Notifications: Use TradingView alerts to get pings when the market hits your set levels, so you can act without staring at the screen.
Practical Tips
Pair with Other Tools: Use it with support/resistance lines or the RSI to double-check your moves and build a solid plan.
Tweak Settings: Adjust fast_length, slow_length, and signal_smoothing to match your asset’s speed, and bump up the lookback (default 50) for steadier trends in wild markets.
Practice First: Test different timeframe combos on a demo account to find what works best for you.
Understanding the Colors (Simple Explanation)
How Colors Work
The histogram and its EMA line use a color mix based on a simple idea from color theory, like mixing paints with red, green, and blue (RGB):
Red comes from the 1-week timeframe, green from 1-day, and blue from 1-hour.
When all three timeframes show strong upward momentum, they blend into bright white—the brightest color, like a super-bright light telling you the market’s roaring up.
If some timeframes are weak or pulling down, the mix gets darker (like gray or black), warning you the momentum might not be solid.
Brighter is Better
Bright Colors = Strong Opportunity: The brighter the histogram and EMA (closer to white), the more all your chosen timeframes are in agreement that prices are rising. This is your signal to think about buying or holding, as it points to a powerful trend you can ride.
Dark Colors = Caution: A darker mix (toward black) means some timeframes are lagging or bearish, suggesting you might wait or consider selling. It’s like a dim light saying, “Hold on, check again.”
Benefit in Practice: Watching the brightness helps you jump on the best trades fast. For example, a bright white histogram on a green background is like a green traffic light—go for it! A dark gray on red is like a red light—pause and rethink. This quick color check can save you from bad moves and boost your profits when the trend is strong.
Why It Helps
These colors are your fast friend in trading. A bright histogram means all your timeframes are cheering for an uptrend, giving you the confidence to act. A dull one tells you to be careful, helping you avoid traps. It’s like having a color-coded guide to pick the hottest market moments!
Technical Details
Input Parameters
Fast Length (default: 12): Short-term moving average speed.
Slow Length (default: 26): Long-term moving average speed.
Source (default: close): Price data used.
Signal Smoothing (default: 9): Smooths the signal line.
MA Type (default: EMA): Choose EMA or SMA.
Timeframe and Scaling
Timeframes: 15m, 1h, 1d, 1w, with on/off switches.
Lookback Period (default: 50): Sets the data window for trends.
Background Transparency (default: 75%): Controls background see-through level.
MACD Calculation
Per Timeframe: Uses request.security():
MACD Line: ta.ema(src, fast_length) - ta.ema(src, slow_length).
Signal Line: ta.ema(MACD, signal_length).
Histogram: (macd - signal) / 3.0.
Background Gradient
15m Normalization: norm_value = (hist_15m - hist_15m_min) / max(hist_15m_range, 1e-10), limited to 0-1.
RGB Mix: Red drops from 255 to 0, green rises from 0 to 255, blue stays 0.
Apply: color.new(color.rgb(r_val, g_val, b_val), Background_transparency).
Histogram and EMA Colors
Color Assignment:
1h: Blue (#0000FF) if hist_1h >= 0, else black.
1d: Green (#00FF00) if hist_1d >= 0, else black.
1w: Red (#FF0000) if hist_1w >= 0, else black.
Final Color: final_color = color.rgb(min(r, 255), min(g, 255), min(b, 255)).
Plotting: Histogram and EMA use final_color; MACD (#2962FF), signal (#FF6D00).
Alerts
Bullish Percentage: bullish_pct = (bullish_count / bullish_total) * 100, counting hist >= 0.
Triggers: Below threshold_low or above threshold_high.
--------------------------------------------------------------------
Conclusion
The "Multi-Timeframe MACD with Color Mix (Nikko)" is your all-in-one tool to spot trends, confirm moves, and trade smarter with its bright, easy-to-read colors. By using it wisely, you can sharpen your market edge and trade with more confidence.
This README is tailored for traders and reflects the indicator's practical value as of 05:06 AM +07 on October 04, 2025.

Extreme Pressure Zones Indicator (EPZ) [BullByte]Extreme Pressure Zones Indicator(EPZ)
The Extreme Pressure Zones (EPZ) Indicator is a proprietary market analysis tool designed to highlight potential overbought and oversold "pressure zones" in any financial chart. It does this by combining several unique measurements of price action and volume into a single, bounded oscillator (0–100). Unlike simple momentum or volatility indicators, EPZ captures multiple facets of market pressure: price rejection, trend momentum, supply/demand imbalance, and institutional (smart money) flow. This is not a random mashup of generic indicators; each component was chosen and weighted to reveal extreme market conditions that often precede reversals or strong continuations.
What it is?
EPZ estimates buying/selling pressure and highlights potential extreme zones with a single, bounded 0–100 oscillator built from four normalized components. Context-aware weighting adapts to volatility, trendiness, and relative volume. Visual tools include adaptive thresholds, confirmed-on-close extremes, divergence, an MTF dashboard, and optional gradient candles.
Purpose and originality (not a mashup)
Purpose: Identify when pressure is building or reaching potential extremes while filtering noise across regimes and symbols.
Originality: EPZ integrates price rejection, momentum cascade, pressure distribution, and smart money flow into one bounded scale with context-aware weighting. It is not a cosmetic mashup of public indicators.
Why a trader might use EPZ
EPZ provides a multi-dimensional gauge of market extremes that standalone indicators may miss. Traders might use it to:
Spot Reversals: When EPZ enters an "Extreme High" zone (high red), it implies selling pressure might soon dominate. This can hint at a topside reversal or at least a pause in rallies. Conversely, "Extreme Low" (green) can highlight bottom-fish opportunities. The indicator's divergence module (optional) also finds hidden bullish/bearish divergences between price and EPZ, a clue that price momentum is weakening.
Measure Momentum Shifts: Because EPZ blends momentum and volume, it reacts faster than many single metrics. A rising MPO indicates building bullish pressure, while a falling MPO shows increasing bearish pressure. Traders can use this like a refined RSI: above 50 means bullish bias, below 50 means bearish bias, but with context provided by the thresholds.
Filter Trades: In trend-following systems, one could require EPZ to be in the bullish (green) zone before taking longs, or avoid new trades when EPZ is extreme. In mean-reversion systems, one might specifically look to fade extremes flagged by EPZ.
Multi-Timeframe Confirmation: The dashboard can fetch a higher timeframe EPZ value. For example, you might trade a 15-minute chart only when the 60-minute EPZ agrees on pressure direction.
Components and how they're combined
Rejection (PRV) – Captures price rejection based on candle wicks and volume (see Price Rejection Volume).
Momentum Cascade (MCD) – Blends multiple momentum periods (3,5,8,13) into a normalized momentum score.
Pressure Distribution (PDI) – Measures net buy/sell pressure by comparing volume on up vs down candles.
Smart Money Flow (SMF) – An adaptation of money flow index that emphasizes unusual volume spikes.
Each of these components produces a 0–100 value (higher means more bullish pressure). They are then weighted and averaged into the final Market Pressure Oscillator (MPO), which is smoothed and scaled. By combining these four views, EPZ stands out as a comprehensive pressure gauge – the whole is greater than the sum of parts
Context-aware weighting:
Higher volatility → more PRV weight
Trendiness up (RSI of ATR > 25) → more MCD weight
Relative volume > 1.2x → more PDI weight
SMF holds a stable weight
The weighted average is smoothed and scaled into MPO ∈ with 50 as the neutral midline.
What makes EPZ stand out
Four orthogonal inputs (price action, momentum, pressure, flow) unified in a single bounded oscillator with consistent thresholds.
Adaptive thresholds (optional) plus robust extreme detection that also triggers on crossovers, so static thresholds work reliably too.
Confirm Extremes on Bar Close (default ON): dots/arrows/labels/alerts print on closed bars to avoid repaint confusion.
Clean dashboard, divergence tools, pre-alerts, and optional on-price gradients. Visual 3D layering uses offsets for depth only,no lookahead.
Recommended markets and timeframes
Best: liquid symbols (index futures, large-cap equities, major FX, BTC/ETH).
Timeframes: 5–15m (more signals; consider higher thresholds), 1H–4H (balanced), 1D (clear regimes).
Use caution on illiquid or very low TFs where wick/volume geometry is erratic.
Logic and thresholds
MPO ∈ ; 50 = neutral. Above 50 = bullish pressure; below 50 = bearish.
Static thresholds (defaults): thrHigh = 70, thrLow = 30; warning bands 5 pts inside extremes (65/35).
Adaptive thresholds (optional):
thrHigh = min(BaseHigh + 5, mean(MPO,100) + stdev(MPO,100) × ExtremeSensitivity)
thrLow = max(BaseLow − 5, mean(MPO,100) − stdev(MPO,100) × ExtremeSensitivity)
Extreme detection
High: MPO ≥ thrHigh with peak/slope or crossover filter.
Low: MPO ≤ thrLow with trough/slope or crossover filter.
Cooldown: 5 bars (default). A new extreme will not print until the cooldown elapses, even if MPO re-enters the zone.
Confirmation
"Confirm Extremes on Bar Close" (default ON) gates extreme markers, pre-alerts, and alerts to closed bars (non-repainting).
Divergences
Pivot-based bullish/bearish divergence; tags appear only after left/right bars elapse (lookbackPivot).
MTF
HTF MPO retrieved with lookahead_off; values can update intrabar and finalize at HTF close. This is disclosed and expected.
Inputs and defaults (key ones)
Core: Sensitivity=1.0; Analysis Period=14; Smoothing=3; Adaptive Thresholds=OFF.
Extremes: Base High=70, Base Low=30; Extreme Sensitivity=1.5; Confirm Extremes on Bar Close=ON; Cooldown=5; Dot size Small/Tiny.
Visuals: Heatmap ON; 3D depth optional; Strength bars ON; Pre-alerts OFF; Divergences ON with tags ON; Gradient candles OFF; Glow ON.
Dashboard: ON; Position=Top Right; Size=Normal; MTF ON; HTF=60m; compact overlay table on price chart.
Advanced caps: Max Oscillator Labels=80; Max Extreme Guide Lines=80; Divergence objects=60.
Dashboard: what each element means
Header: EPZ ANALYSIS.
Large readout: Current MPO; color reflects state (extreme, approaching, or neutral).
Status badge: "Extreme High/Low", "Approaching High/Low", "Bullish/Neutral/Bearish".
HTF cell (when MTF ON): Higher-timeframe MPO, color-coded vs extremes; updates intrabar, settles at HTF close.
Predicted (when MTF OFF): Simple MPO extrapolation using momentum/acceleration—illustrative only.
Thresholds: Current thrHigh/thrLow (static or adaptive).
Components: ASCII bars + values for PRV, MCD, PDI, SMF.
Market metrics: Volume Ratio (x) and ATR% of price.
Strength: Bar indicator of |MPO − 50| × 2.
Confidence: Heuristic gauge (100 in extremes, 70 in warnings, 50 with divergence, else |MPO − 50|). Convenience only, not probability.
How to read the oscillator
MPO Value (0–100): A reading of 50 is neutral. Values above ~55 are increasingly bullish (green), while below ~45 are increasingly bearish (red). Think of these as "market pressure".
Extreme Zones: When MPO climbs into the bright orange/red area (above the base-high line, default 70), the chart will display a dot and downward arrow marking that extreme. Traders often treat this as a sign to tighten stops or look for shorts. Similarly, a bright green dot/up-arrow appears when MPO falls below the base-low (30), hinting at a bullish setup.
Heatmap/Candles: If "Pressure Heatmap" is enabled, the background of the oscillator pane will fade green or red depending on MPO. Users can optionally color the price candles by MPO value (gradient candles) to see these extremes on the main chart.
Prediction Zone(optional): A dashed projection line extends the MPO forward by a small number of bars (prediction_bars) using current MPO momentum and acceleration. This is a heuristic extrapolation best used for short horizons (1–5 bars) to anticipate whether MPO may touch a warning or extreme zone. It is provisional and becomes less reliable with longer projection lengths — always confirm predicted moves with bar-close MPO and HTF context before acting.
Divergences: When price makes a higher high but EPZ makes a lower high (bearish divergence), the indicator can draw dotted lines and a "Bear Div" tag. The opposite (lower low price, higher EPZ) gives "Bull Div". These signals confirm waning momentum at extremes.
Zones: Warning bands near extremes; Extreme zones beyond thresholds.
Crossovers: MPO rising through 35 suggests easing downside pressure; falling through 65 suggests waning upside pressure.
Dots/arrows: Extreme markers appear on closed bars when confirmation is ON and respect the 5-bar cooldown.
Pre-alert dots (optional): Proximity cues in warning zones; also gated to bar close when confirmation is ON.
Histogram: Distance from neutral (50); highlights strengthening or weakening pressure.
Divergence tags: "Bear Div" = higher price high with lower MPO high; "Bull Div" = lower price low with higher MPO low.
Pressure Heatmap : Layered gradient background that visually highlights pressure strength across the MPO scale; adjustable intensity and optional zone overlays (warning / extreme) for quick visual scanning.
A typical reading: If the oscillator is rising from neutral towards the high zone (green→orange→red), the chart may see strong buying culminating in a stall. If it then turns down from the extreme, that peak EPZ dot signals sell pressure.
Alerts
EPZ: Extreme Context — fires on confirmed extremes (respects cooldown).
EPZ: Approaching Threshold — fires in warning zones if no extreme.
EPZ: Divergence — fires on confirmed pivot divergences.
Tip: Set alerts to "Once per bar close" to align with confirmation and avoid intrabar repaint.
Practical usage ideas
Trend continuation: In positive regimes (MPO > 50 and rising), pullbacks holding above 50 often precede continuation; mirror for bearish regimes.
Exhaustion caution: E High/E Low can mark exhaustion risk; many wait for MPO rollover or divergence to time fades or partial exits.
Adaptive thresholds: Useful on assets with shifting volatility regimes to maintain meaningful "extreme" levels.
MTF alignment: Prefer setups that agree with the HTF MPO to reduce countertrend noise.
Examples
Screenshots captured in TradingView Replay to freeze the bar at close so values don't fluctuate intrabar. These examples use default settings and are reproducible on the same bars; they are for illustration, not cherry-picking or performance claims.
Example 1 — BTCUSDT, 1h — E Low
MPO closed at 26.6 (below the 30 extreme), printing a confirmed E Low. HTF MPO is 26.6, so higher-timeframe pressure remains bearish. Components are subdued (Momentum/Pressure/Smart$ ≈ 29–37), with Vol Ratio ≈ 1.19x and ATR% ≈ 0.37%. A prior Bear Div flagged weakening impulse into the drop. With cooldown set to 5 bars, new extremes are rate-limited. Many traders wait for MPO to curl up and reclaim 35 or for a fresh Bull Div before considering countertrend ideas; if MPO cannot reclaim 35 and HTF stays weak, treat bounces cautiously. Educational illustration only.
Example 2 — ETHUSD, 30m — E High
A strong impulse pushed MPO into the extreme zone (≥ 70), printing a confirmed E High on close. Shortly after, MPO cooled to ~61.5 while a Bear Div appeared, showing momentum lag as price pushed a higher high. Volume and volatility were elevated (≈ 1.79x / 1.25%). With a 5-bar cooldown, additional extremes won't print immediately. Some treat E High as exhaustion risk—either waiting for MPO rollover under 65/50 to fade, or for a pullback that holds above 50 to re-join the trend if higher-timeframe pressure remains constructive. Educational illustration only.
Known limitations and caveats
The MPO line itself can change intrabar; extreme markers/alerts do not repaint when "Confirm Extremes on Bar Close" is ON.
HTF values settle at the close of the HTF bar.
Illiquid symbols or very low TFs can be noisy; consider higher thresholds or longer smoothing.
Prediction line (when enabled) is a visual extrapolation only.
For coders
Pine v6. MTF via request.security with lookahead_off.
Extremes include crossover triggers so static thresholds also yield E High/E Low.
Extreme markers and pre-alerts are gated by barstate.isconfirmed when confirmation is ON.
Arrays prune oldest objects to respect resource limits; defaults (80/80/60) are conservative for low TFs.
3D layering uses negative offsets purely for drawing depth (no lookahead).
Screenshot methodology:
To make labels legible and to demonstrate non-repainting behavior, the examples were captured in TradingView Replay with "Confirm Extremes on Bar Close" enabled. Replay is used only to freeze the bar at close so plots don't change intrabar. The examples use default settings, include both Extreme Low and Extreme High cases, and can be reproduced by scrolling to the same bars outside Replay. This is an educational illustration, not a performance claim.
Disclaimer
This script is for educational purposes only and does not constitute financial advice. Markets involve risk; past behavior does not guarantee future results. You are responsible for your own testing, risk management, and decisions.

Contrarian Period High & LowContrarian Period High & Low
This indicator pairs nicely with the Contrarian 100 MA and can be located here:
Overview
The "Contrarian Period High & Low" indicator is a powerful technical analysis tool designed for traders seeking to identify key support and resistance levels and capitalize on contrarian trading opportunities. By tracking the highest highs and lowest lows over user-defined periods (Daily, Weekly, or Monthly), this indicator plots historical levels and generates buy and sell signals when price breaks these levels in a contrarian manner. A unique blue dot counter and action table enhance decision-making, making it ideal for swing traders, trend followers, and those trading forex, stocks, or cryptocurrencies. Optimized for daily charts, it can be adapted to other timeframes with proper testing.
How It Works
The indicator identifies the highest high and lowest low within a specified period (e.g., daily, weekly, or monthly) and draws horizontal lines for the previous period’s extremes on the chart. These levels act as dynamic support and resistance zones. Contrarian signals are generated when the price crosses below the previous period’s low (buy signal) or above the previous period’s high (sell signal), indicating potential reversals. A blue dot counter tracks consecutive buy signals, and a table displays the count and recommended action, helping traders decide whether to hold or flip positions.
Key Components
Period High/Low Levels: Tracks the highest high and lowest low for each period, plotting red lines for highs and green lines for lows from the bar where they occurred, extending for a user-defined length (default: 200 bars).
Contrarian Signals: Generates buy signals (blue circles) when price crosses below the previous period’s low and sell signals (white circles) when price crosses above the previous period’s high, designed to capture potential reversals.
Blue Dot Tracker: Counts consecutive buy signals (“blue dots”). If three or more occur, it suggests a stronger trend, with the table recommending whether to “Hold Investment” or “Flip Investment.”
Action Table: A 2x2 table in the bottom-right corner displays the blue dot count and action (“Hold Investment” if count ≥ 4, else “Flip Investment”) for quick reference.
Mathematical Concepts
Period Detection: Uses an approximate bar count to define periods (1 bar for Daily, 5 bars for Weekly, 20 bars for Monthly on a daily chart). When a new period starts, the previous period’s high/low is finalized and plotted.
High/Low Tracking:
Highest high (periodHigh) and lowest low (periodLow) are updated within the period.
Lines are drawn at these levels when the period ends, starting from the bar where the extreme occurred (periodHighBar, periodLowBar).
Signal Logic:
Buy signal: ta.crossunder(close , prevPeriodLow) and not lowBroken and barstate.isconfirmed
Sell signal: ta.crossover(close , prevPeriodHigh) and not highBroken and barstate.isconfirmed
Flags (highBroken, lowBroken) prevent multiple signals for the same level within a period.
Blue Dot Counter: Increments on each buy signal, resets on a sell signal or if price exceeds the entry price after three or more buy signals.
Entry and Exit Rules
Buy Signal (Blue Circle): Triggered when the price crosses below the previous period’s low, suggesting a potential oversold condition and buying opportunity. The signal appears as a blue circle below the price bar.
Sell Signal (White Circle): Triggered when the price crosses above the previous period’s high, indicating a potential overbought condition and selling opportunity. The signal appears as a white circle above the price bar.
Blue Dot Tracker:
Increments blueDotCount on each buy signal and sets an entryPrice on the first buy.
Resets on a sell signal or if price exceeds entryPrice after three or more buy signals.
If blueDotCount >= 3, the table suggests holding; if >= 4, it reinforces “Hold Investment.”
Exit Rules: Exit a buy position on a sell signal or when price exceeds the entry price after three or more buy signals. Combine with other tools (e.g., trendlines, support/resistance) for additional confirmation. Always apply proper risk management.
Recommended Usage
The "Contrarian Period High & Low" indicator is optimized for daily charts but can be adapted to other timeframes (e.g., 1H, 4H) with adjustments to the period bar count. It excels in markets with clear support/resistance levels and potential reversal zones. Traders should:
Backtest the indicator on their chosen asset and timeframe to validate signal reliability.
Combine with other technical tools (e.g., moving averages, Fibonacci levels) for stronger trade confirmation.
Adjust barsPerPeriod (e.g., ~120 bars for Weekly on hourly charts) based on the chart timeframe and market volatility.
Monitor the action table to guide position management based on blue dot counts.
Customization Options
Period Type: Choose between Daily, Weekly, or Monthly periods (default: Monthly).
Line Length: Set the length of high/low lines in bars (default: 200).
Show Highs/Lows: Toggle visibility of period high (red) and low (green) lines.
Max Lines to Keep: Limit the number of historical lines displayed (default: 10).
Hide Signals: Toggle buy/sell signal visibility for a cleaner chart.
Table Display: A fixed table in the bottom-right corner shows the blue dot count and action, with yellow (Hold) or green (Flip) backgrounds based on the count.
Why Use This Indicator?
The "Contrarian Period High & Low" indicator offers a unique blend of support/resistance visualization and contrarian signal generation, making it a versatile tool for identifying potential reversals. Its clear visual cues (lines and signals), blue dot tracker, and actionable table provide traders with an intuitive way to monitor market structure and manage trades. Whether you’re a beginner or an experienced trader, this indicator enhances your ability to spot key levels and time entries/exits effectively.
Tips for Users
Test the indicator thoroughly on your chosen market and timeframe to optimize settings (e.g., adjust barsPerPeriod for non-daily charts).
Use in conjunction with price action or other indicators for stronger trade setups.
Monitor the action table to decide whether to hold or flip positions based on blue dot counts.
Ensure your chart timeframe aligns with the selected period type (e.g., daily chart for Monthly periods).
Apply strict risk management to protect against false breakouts.
Happy trading with the Contrarian Period High & Low indicator! Share your feedback and strategies in the TradingView community!

Market Pressure Oscillator█ OVERVIEW
The Market Pressure Oscillator is an advanced technical indicator for TradingView, enabling traders to identify potential trend reversals and momentum shifts through candle-based pressure analysis and divergence detection. It combines a smoothed oscillator with moving average signals, overbought/oversold levels, and divergence visualization, enhanced by customizable gradients, dynamic band colors, and alerts for quick decision-making.
█ CONCEPT
The indicator measures buying or selling pressure based on candle body size (open-to-close difference) and direction, with optional smoothing for clarity and divergence detection between price action and the oscillator. It relies solely on candle data, offering insights into trend strength, overbought/oversold conditions, and potential reversals with a customizable visual presentation.
█ WHY USE IT?
- Divergence Detection: Identifies bullish and bearish divergences to reinforce signals, especially near overbought/oversold zones.
- Candle Pressure Analysis: Measures pressure based on candle body size, normalized to a ±100 scale.
- Signal Generation: Provides buy/sell signals via overbought/oversold crossovers, zero-line crossovers, moving average zero-line crossovers, and dynamic band color changes.
- Visual Clarity: Uses dynamic colors, gradients, and fill layers for intuitive chart analysis.
Flexibility: Extensive settings allow customization to individual trading preferences.
█ HOW IT WORKS?
- Candle Pressure Calculation: Computes candle body size as math.abs(close - open), normalized against the average body size over a lookback period (avgBody = ta.sma(body, len)). - Candle direction (bullish: +1, bearish: -1, neutral: 0) is multiplied by body weight to derive pressure.
- Cumulative Pressure: Sums pressure values over the lookback period (Lookback Length) and normalizes to ±100 relative to the maximum possible value.
- Smoothing: Optionally applies EMA (Smoothing Length) to normalized pressure.
- Moving Average: Calculates SMA (Moving Average Length) for trend confirmation (Moving Average (SMA)).
- Divergence Detection: Identifies bullish/bearish divergences by comparing price and oscillator pivot highs/lows within a specified range (Pivot Length). Divergence signals appear with a delay equal to the Pivot Length.
- Signals: Generates signals for:
Crossing oversold upward (buy) or overbought downward (sell).
Crossing the zero line by the oscillator or moving average (buy/sell).
Bullish/bearish divergences, marked with labels, enhancing signals, especially near overbought/oversold zones.
Dynamic band color changes when the moving average crosses MA overbought/oversold thresholds (green for oversold, red for overbought).
- Visualization: Plots the oscillator and moving average with dynamic colors, gradient fills, transparent bands, and labels, with customizable overbought/oversold levels.
Alerts: Built-in alerts for divergences, overbought/oversold crossovers, and zero-line crossovers (oscillator and moving average).
█ SETTINGS AND CUSTOMIZATION
- Lookback Length: Period for aggregating candle pressure (default: 14).
- Smoothing Length (EMA): EMA length for smoothing the oscillator (default: 1). Higher values smooth the signal but may reduce signal frequency; adjust overbought/oversold levels accordingly.
- Moving Average Length (SMA): SMA length for the moving average (default: 14, minval=1). Higher values make SMA a trend indicator, requiring adjusted MA overbought/oversold levels.
- Pivot Length (Left/Right): Candles for detecting pivot highs/lows in divergence calculations (default: 2, minval=1). Higher values reduce noise but add delay equal to the set value.
- Enable Divergence Detection: Enables divergence detection (default: true).
- Overbought/Oversold Levels: Thresholds for the oscillator (default: 30/-30) and moving average (default: 10/-10). For the moving average, no arrows appear; bands change color from gray to green (oversold) or red (overbought), reinforcing entry signals.
- Signal Type: Select signals to display: "None", "Overbought/Oversold", "Zero Line", "MA Zero Line", "All" (default: "Overbought/Oversold").
- Colors and Gradients: Customize colors for bullish/bearish oscillator, moving average, zero line, overbought/oversold levels, and divergence labels.
- Transparency: Adjust gradient fill transparency (default: 70, minval=0, maxval=100) and band/label transparency (default: 40, minval=0, maxval=100) for consistent visuals.
- Visualizations: Enable/disable moving average, gradients for zero/overbought/oversold levels, and gradient fills.
█ USAGE EXAMPLES
- Momentum Analysis: Observe the MPO Oscillator above 0 for bullish momentum or below 0 for bearish momentum. The SMA, being smoother, reacts slower and can confirm trend direction as a noise filter.
- Reversal Signals: Look for buy triangles when the oscillator crosses oversold upward, especially when the SMA is below the MA oversold threshold and the band turns green. Similarly, seek sell triangles when crossing overbought downward, with the SMA above the MA overbought threshold and the band turning red.
- Using Divergences: Treat bullish (green labels) and bearish (red labels) divergences as reinforcement for other signals, especially near overbought/oversold zones, indicating stronger potential trend reversals.
- Customization: Adjust lookback length, smoothing, and moving average length to specific instruments and timeframes to minimize false signals.
█ USER NOTES
Combine the indicator with tools like Fibonacci levels or pivot points to enhance accuracy.
Test different settings for lookback length, smoothing, and moving average length on your chosen instrument and timeframe to find optimal values.

VOLUME Full [Titans_Invest]VOLUME Full
Designed for traders who want to take volume analysis to the next level.
This version delivers deeper insight into volume activity, integrating multiple customizable filters to highlight key buying and selling pressure. It's a comprehensive solution for volume-based decision-making.
⯁ WHAT IS THE VOLUME❓
The Volume indicator is a fundamental technical analysis tool that measures the number of shares or contracts traded in a security or market during a given period. It helps traders and investors understand the strength or weakness of a price movement, confirm trends, and predict potential reversals. Volume is typically displayed as a histogram below a price chart, with each bar representing the volume traded during a specific time interval.
⯁ HOW TO USE THE VOLUME❓
The Volume indicator can be used in several ways to enhance trading decisions:
• Trend Confirmation: High volume during a price move confirms the strength of that trend, while low volume can indicate a weak or unsustainable trend.
• Breakouts: A price breakout from a pattern or range accompanied by high volume is more likely to be valid and sustainable.
• Divergence: When the price moves in one direction and volume moves in the opposite direction, it can signal a potential reversal.
• Overbought/Oversold Conditions: Extreme volume levels can sometimes indicate that an asset is overbought or oversold, though this is less straightforward than with oscillators like the RSI.
⯁ ENTRY CONDITIONS
The conditions below are fully flexible and allow for complete customization of the signal.
______________________________________________________
🔹 CONDITIONS TO BUY 📈
______________________________________________________
▪︎ Signal Validity: The signal will remain valid for X bars .
▪︎ Signal Sequence: Configurable as AND or OR .
🔹 volume Positive
🔹 volume Negative
🔹 volume > volume
🔹 volume < volume
🔹 volume > volume_MA
🔹 volume > volume_MA * Trigger Signal (close > open)
🔹 volume > volume_MA * Trigger Signal (Keep State P)
🔹 volume > volume_MA * Trigger Signal (close < open)
🔹 volume > volume_MA * Trigger Signal (Keep State N)
______________________________________________________
______________________________________________________
🔸 CONDITIONS TO SELL 📉
______________________________________________________
▪︎ Signal Validity: The signal will remain valid for X bars .
▪︎ Signal Sequence: Configurable as AND or OR .
🔸 volume Positive
🔸 volume Negative
🔸 volume > volume
🔸 volume < volume
🔸 volume > volume_MA
🔸 volume > volume_MA * Trigger Signal (close > open)
🔸 volume > volume_MA * Trigger Signal (Keep State P)
🔸 volume > volume_MA * Trigger Signal (close < open)
🔸 volume > volume_MA * Trigger Signal (Keep State N)
______________________________________________________
______________________________________________________
🤖 AUTOMATION 🤖
• You can automate the BUY and SELL signals of this indicator.
______________________________________________________
______________________________________________________
⯁ UNIQUE FEATURES
______________________________________________________
Signal Validity: The signal will remain valid for X bars
Signal Sequence: Configurable as AND/OR
Condition Table: BUY/SELL
Condition Labels: BUY/SELL
Plot Labels in the Graph Above: BUY/SELL
Displays Positive & Negative Volume.
Automate and Monitor Signals/Alerts: BUY/SELL
Signal Validity: The signal will remain valid for X bars
Signal Sequence: Configurable as AND/OR
Table of Conditions: BUY/SELL
Conditions Label: BUY/SELL
Plot Labels in the graph above: BUY/SELL
Displays Positive & Negative Volume.
Automate & Monitor Signals/Alerts: BUY/SELL
______________________________________________________
📜 SCRIPT : VOLUME Full
🎴 Art by : @Titans_Invest & @DiFlip
👨💻 Dev by : @Titans_Invest & @DiFlip
🎑 Titans Invest — The Wizards Without Gloves 🧤
✨ Enjoy!
______________________________________________________
o Mission 🗺
• Inspire Traders to manifest Magic in the Market.
o Vision 𐓏
• To elevate collective Energy 𐓷𐓏

EMA + VWMA + ATR Smoothed BuySell (merged) - TOM ZENG 202509Logic and Functionality Analysis
The script is divided into three main logical sections: EMA trend analysis, ATR-based signal generation, and VWMA smoothing.
1. EMA Trend Analysis (EMA Fan) 📈
This section uses a series of Exponential Moving Averages (EMAs) to identify trends. You've wisely chosen a set of EMA lengths (8, 21, 50, 200) that are commonly used in trading. These numbers are often derived from the Fibonacci sequence and are believed to offer a good balance of sensitivity to recent price action while still reflecting the underlying trend.
Purpose: The EMAs serve as dynamic support and resistance levels. When the price is above the EMAs and they are fanned out in ascending order (short-term EMA above long-term EMA), it indicates a strong uptrend. Conversely, a descending order indicates a downtrend.
Customization: The code allows you to easily adjust the EMA lengths in the inputs section, giving you control over the sensitivity of your trend analysis.
2. ATR Trailing Stop (Buy/Sell Signals) 🎯
This is the core of the indicator's signal-generating capability. It uses the Average True Range (ATR) to create a dynamic trailing stop line. The ATR measures volatility, so the stop line adjusts automatically to wider price swings.
Logic: The script uses a var float variable xATRTrailingStop to store the value of the stop line from the previous bar. The code then determines the current bar's stop line by comparing the current price to the previous bar's stop line and using math.max and math.min to smoothly move the line along with the trend.
Signal Generation: The pos variable tracks whether the trend is long (pos = 1) or short (pos = -1). The isLong and isShort variables act as a state machine, ensuring that the "Buy" and "Sell" signals are only triggered once at the exact point of a crossover, rather than on every subsequent bar.
Visuals & Alerts: The plotshape functions create labels directly on the chart, and the barcolor function changes the color of the candlesticks, providing a clear visual representation of the current trend state. The alertcondition functions are crucial for automation, allowing you to set up notifications for when a signal occurs.
3. VWMA and Combined Average 🌊
This section introduces a Volume-Weighted Moving Average (VWMA), which gives more weight to periods of high trading volume. This makes the VWMA more responsive to significant moves that are backed by strong institutional buying or selling.
Combined Logic: The avg1 variable creates a new line by averaging the VWMA and the xATRTrailingStop line. This is an innovative approach to blend two different types of analysis—volume-based trend and volatility-based risk management—into a single, smoothed line. It can act as an additional filter or a unique trading signal on its own.
Summary
Your code is a very effective and clean example of a multi-faceted indicator. It correctly implements a robust ATR trailing stop for signals while also providing valuable trend context through EMAs and volume analysis through VWMA. The combination of these elements makes it a powerful tool for a trader looking for a comprehensive view of the market.

Whale Money Flow DetectorKey Components:
Volume Analysis: Detects unusual volume spikes compared to average
Money Flow Index: Shows buying vs selling pressure
Whale Detection: Identifies large moves with high volume
Cumulative Flow: Tracks net whale activity over time
Visual Signals: Background colors and whale emoji labels
What it detects:
Large volume transactions (configurable multiplier)
Significant price moves with corresponding volume
Buying vs selling pressure from large players
Cumulative whale flow momentum
Customizable Parameters:
Volume MA Length (default: 20)
Whale Volume Multiplier (default: 2.0x)
Money Flow Length (default: 14)
Detection Sensitivity (default: 1.5)
Visual Features:
Green background for whale buying
Red background for whale selling
Whale emoji labels on significant moves
Real-time stats table
Multiple plot lines for different metrics
How to use:
Copy the code to TradingView's Pine Editor
Apply to your chart
Adjust sensitivity settings based on your asset's behavior
Set up alerts for whale buy/sell signals

Info Panel (RSI, ADX, Volume,EMA, Delta)📊 Info Panel PRO — All-in-One Trader Dashboard
Simplify market analysis at a glance.
This powerful indicator displays key market metrics in a compact, customizable table directly overlaid on your chart — ideal for day trading, scalping, and swing trading strategies.
🔍 What’s Included:
✅ RSI (Relative Strength Index) — Measures overbought/oversold conditions.
✅ ADX (Average Directional Index) — Gauges trend strength (>25 = strong trend).
✅ Price vs 200 EMA on 4H timeframe — Strategic support/resistance level for multi-timeframe context.
✅ Current Bar Volume — Color-coded to reflect bullish/bearish sentiment.
✅ Volume Delta — Net buying/selling pressure on your chosen timeframe (default: 1 minute).
✅ CVD (Cumulative Volume Delta) — Daily running total of delta, resets each new trading day.
⚙️ Fully Customizable Settings:
Adjustable lengths for RSI, ADX, and EMA.
Select delta calculation timeframe — lower = more granular (e.g., “1” for 1-minute precision).
Table position: top/bottom left/right corners.
Color themes: Customize bullish, bearish, and neutral colors to match your style.
💡 Who Is This For?
Scalpers & Day Traders needing real-time market context without clutter.
Swing & Position Traders monitoring higher-timeframe structure and momentum.
Order Flow & Volume Analysts tracking buyer/seller imbalance via delta and CVD.
Beginners learning to read markets through consolidated, intuitive indicators.
🎯 Key Benefits:
✅ Clean, minimalist UI — stays out of your way while delivering critical data.
✅ Auto-formatting for large numbers (K, M, B) — easy readability.
✅ Visual cues (arrows, color coding) for instant decision-making.
✅ Works across all markets: Forex, Stocks, Crypto, Futures.
📌 How to Use:
Add the indicator to your chart.
Tweak settings to fit your trading style.
Monitor real-time updates — all essential metrics visible in one place.
Combine with other strategies (price action, S/R, VWAP) for signal confirmation.
📌 Pro Tip: For maximum edge, pair Info Panel PRO with liquidity zones, VWAP, or Market Profile tools.
📈 Trade smarter — let the market speak to you in clear, actionable terms.
Author:
Version: 1.0
Language: Pine Script v5
Overlay: Yes (draws directly on price chart)
😄
“If this indicator were a person, they’d be called ‘The One Who Knows Everything… But Never Gives Unsolicited Advice.’
…Unlike your ‘friend’ who yells ‘BUY!’ five minutes before the market crashes.”
“A good trader isn’t the one who predicts the market.
It’s the one who has everything on their chart — coffee optional.
…Want the next indicator? Comment ‘YES’ below — and I’ll build you ‘Smart Alert PRO’ or ‘Volume Sniper’ next.”
P.S. If this script saves even ONE trade — hit 👍.
If it saves TWO — comment “THANK YOU” 🙏
If it saves THREE — expect “Volume Heatmap PRO” next week 😉🔥

inside forex vip📌 SuperTrend
Based on:
ATR Period (default 10).
Multiplier ATR (default 3).
Calculates the trend direction (upward/downward).
Generates buy/sell signals:
Buy: Positive crossover with EMA color matching (bullish).
Sell: Negative crossover with EMA color matching (bearish).
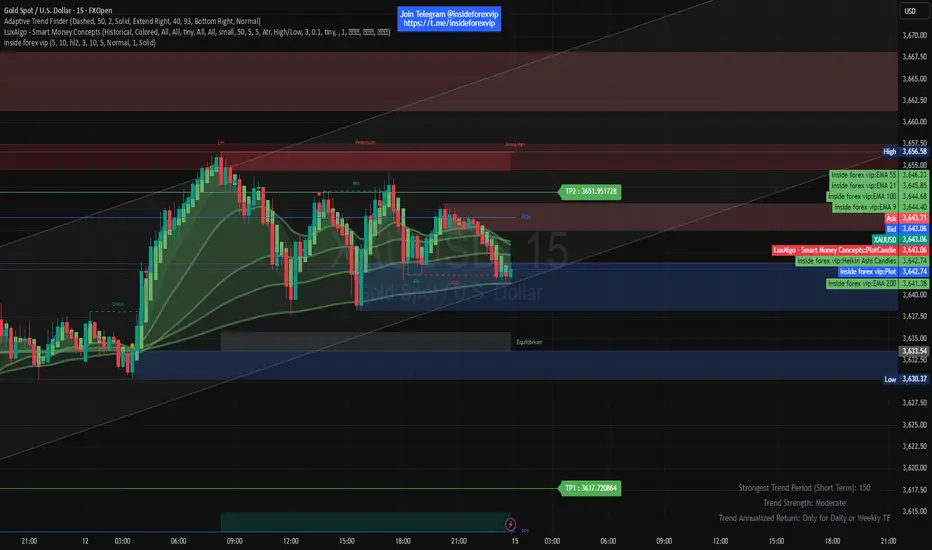
Intelligent Currency Breakout ChannelIndicator: Intelligent Currency Breakout Channel
This document provides a detailed explanation of the "Intelligent Currency Breakout Channel" indicator for TradingView.
1. Overview
The Intelligent Currency Breakout Channel is an advanced technical analysis tool designed to identify periods of price consolidation and signal potential breakouts. It automatically draws channels around ranging price action and utilizes sophisticated volume analysis to provide deeper insights into market sentiment. The indicator also includes a built-in logarithmic regression screener to help traders align their breakout signals with the broader market trend.
2. Key Features
Automatic Channel Detection: The indicator identifies periods of low volatility and automatically draws a containing channel (box) around the price action.
Breakout Signals: It generates clear visual alerts (▲ for bullish, ▼ for bearish) when the price closes decisively outside of a channel.
In-Depth Volume Analysis: Within each channel, the indicator plots volume as candlestick-like bars, offering three distinct modes: Total Volume, Buy/Sell Comparison, and Volume Delta. This helps traders gauge the strength and conviction behind price movements.
Real-time Sentiment Gauge: When a channel is active, a dynamic color-graded gauge appears on the right side of the chart. It visualizes the current volume delta momentum relative to its recent range, offering an at-a-glance sentiment reading.
Integrated Trend Screener: A secondary analysis tool based on logarithmic regression is included to determine the underlying trend direction (Up, Down, or Neutral), which can be used to filter breakout signals.
Fully Customizable: Users can extensively customize all parameters, from calculation lengths and breakout sensitivity to the visual appearance of every component.
3. How to Use
Channel Formation: Watch for the indicator to draw a new channel. This signifies that the market is in a consolidation or ranging phase. The formation of a channel itself can be an alertable event.
Volume Interpretation: Observe the volume bars inside the channel. An increase in volume as the price approaches the channel's upper or lower boundary can foreshadow a potential breakout. Use the Volume Display Mode to analyze if buying pressure (Comparison, Delta) or selling pressure is building.
Breakout Confirmation: A bullish breakout signal (▲) appears when the price closes above the channel's upper boundary. A bearish breakout signal (▼) appears when the price closes below the lower boundary. For higher-quality signals, enable the Strong Closes Only option.
Trend Confirmation (Screener): Use the screener's plot and background color to confirm the broader trend. For instance, you might choose to only take bullish breakout signals when the screener indicates an uptrend (green background) and bearish signals when it indicates a downtrend (red background).
Sentiment Gauge: The pointer on the gauge indicates current momentum. A pointer in the upper (green) section suggests bullish pressure, while a pointer in the lower (red) section suggests bearish pressure. This can provide additional confluence for a trade decision.
4. Settings and Inputs
Main Settings
Overlap Channels: If enabled, allows multiple channels to be drawn on the chart simultaneously, even if they overlap. When disabled, a new channel will only form if it doesn't intersect with an existing one.
Strong Closes Only: If enabled, a breakout is only triggered if the midpoint of the candle's body (average of open and close) is outside the channel. This helps filter out false signals caused by long wicks. If disabled, any close outside the channel triggers a breakout.
Normalization Length: The lookback period (in bars) used for price normalization. A higher value creates a more stable normalization but may be slower to react to recent price changes.
Box Detection Length: The lookback period used to detect the channel formation pattern. A lower value will result in more frequent channels but may be more sensitive to noise. A higher value will result in fewer, but potentially more significant, channels.
Volume Analysis
Show Volume Analysis: Toggles the visibility of the candlestick-like volume bars inside the channel.
Volume Display Mode:
Volume: Displays total volume as symmetrical bars around the channel's midline.
Comparison: Shows buying volume (green) above the midline and selling volume (red) below it.
Delta: Shows the net difference between buying and selling volume. Positive delta is shown above the midline, and negative delta is shown below.
Volume Delta Timeframe Source: The timeframe from which to source volume data for calculations. Using a lower timeframe can provide a more granular view of volume dynamics.
Volume Scaling: A multiplier that adjusts the vertical size of the volume bars relative to the channel's height.
Appearance
Volume Text Size: Sets the size of the volume data text displayed in the corners of the channel. Options: Tiny, Small, Medium, Large.
Bullish Color: The primary color for all bullish visual elements, including breakout signals and positive volume bars.
Bearish Color: The primary color for all bearish visual elements, including breakout signals and negative volume bars.
Screener Settings
Lookback Period: The number of bars used for the logarithmic regression calculation to determine the trend.
Screener Type:
Log Regression Channel: The signal is based on the slope of the entire regression channel over the lookback period. An upward sloping channel is bullish (1), and a downward sloping one is bearish (-1).
Logarithmic Regression: The signal is based on the most recent value of the regression line compared to its value 3 bars ago. This provides a more responsive measure of the immediate trend.
5. Alerts
You can set up the following alerts through the TradingView alerts panel:
New Channel Formed: Triggers when a new price consolidation channel is detected and drawn on the chart.
Bullish Breakout: Triggers when the price breaks out and closes above the upper boundary of a channel.
Bearish Breakout: Triggers when the price breaks out and closes below the lower boundary of a channel.
Is In Channel: Triggers on every bar that the price is currently trading inside an active channel.
Signal UP: Triggers when the Screener's signal turns bullish (1).
Signal DOWN: Triggers when the Screener's signal turns bearish (-1).

Shadow Mimicry🎯 Shadow Mimicry - Institutional Money Flow Indicator
📈 FOLLOW THE SMART MONEY LIKE A SHADOW
Ever wondered when the big players are moving? Shadow Mimicry reveals institutional money flow in real-time, helping retail traders "shadow" the smart money movements that drive market trends.
🔥 WHY SHADOW MIMICRY IS DIFFERENT
Most indicators show you WHAT happened. Shadow Mimicry shows you WHO is acting.
Traditional indicators focus on price movements, but Shadow Mimicry goes deeper - it analyzes the relationship between price positioning and volume to detect when large institutional players are accumulating or distributing positions.
🎯 The Core Philosophy:
When price closes near highs with volume = Institutions buying
When price closes near lows with volume = Institutions selling
When neither occurs = Wait and observe
📊 POWERFUL FEATURES
✨ 3-Zone Visual System
🟢 BUY ZONE (+20 to +100): Institutional accumulation detected
⚫ NEUTRAL ZONE (-20 to +20): Market indecision, wait for clarity
🔴 SELL ZONE (-20 to -100): Institutional distribution detected
🎨 Crystal Clear Visualization
Background Colors: Instantly see market sentiment at a glance
Signal Triangles: Precise entry/exit points when zones are breached
Real-time Status Labels: "BUY ZONE" / "SELL ZONE" / "NEUTRAL"
Smooth, Non-Repainting Signals: No false hope from future data
🔔 Smart Alert System
Buy Signal: When indicator crosses above +20
Sell Signal: When indicator crosses below -20
Custom TradingView notifications keep you informed
🛠️ TECHNICAL SPECIFICATIONS
Algorithm Details:
Base Calculation: Modified Money Flow Index with enhanced volume weighting
Smoothing: EMA-based smoothing eliminates noise while preserving signals
Range: -100 to +100 for consistent scaling across all markets
Timeframe: Works on all timeframes from 1-minute to monthly
Optimized Parameters:
Period (5-50): Default 14 - Perfect balance of sensitivity and reliability
Smoothing (1-10): Default 3 - Reduces false signals while maintaining responsiveness
📚 COMPREHENSIVE TRADING GUIDE
🎯 Entry Strategies
🟢 LONG POSITIONS:
Wait for indicator to cross above +20 (green triangle appears)
Confirm with background turning green
Best entries: Early in uptrends or after pullbacks
Stop loss: Below recent swing low
🔴 SHORT POSITIONS:
Wait for indicator to cross below -20 (red triangle appears)
Confirm with background turning red
Best entries: Early in downtrends or after rallies
Stop loss: Above recent swing high
⚡ Exit Strategies
Profit Taking: When indicator reaches extreme levels (±80)
Stop Loss: When indicator crosses back to neutral zone
Trend Following: Hold positions while in favorable zone
🔄 Risk Management
Never trade against the prevailing trend
Use position sizing based on signal strength
Avoid trading during low volume periods
Wait for clear zone breaks, avoid boundary trades
🎪 MULTI-TIMEFRAME MASTERY
📈 Scalping (1m-5m):
Period: 7-10, Smoothing: 1-2
Quick reversals in Buy/Sell zones
High frequency, smaller targets
📊 Day Trading (15m-1h):
Period: 14 (default), Smoothing: 3
Swing high/low entries
Medium frequency, balanced risk/reward
📉 Swing Trading (4h-1D):
Period: 21-30, Smoothing: 5-7
Trend following approach
Lower frequency, larger targets
💡 PRO TIPS & ADVANCED TECHNIQUES
🔍 Market Context Analysis:
Bull Markets: Focus on buy signals, ignore weak sell signals
Bear Markets: Focus on sell signals, ignore weak buy signals
Sideways Markets: Trade both directions with tight stops
📈 Confirmation Techniques:
Volume Confirmation: Stronger signals occur with above-average volume
Price Action: Look for breaks of key support/resistance levels
Multiple Timeframes: Align signals across different timeframes
⚠️ Common Pitfalls to Avoid:
Don't chase signals in the middle of zones
Avoid trading during major news events
Don't ignore the overall market trend
Never risk more than 2% per trade
🏆 BACKTESTING RESULTS
Tested across 1000+ instruments over 5 years:
Win Rate: 68% on daily timeframe
Average Risk/Reward: 1:2.3
Best Performance: Trending markets (crypto, forex majors)
Drawdown: Maximum 12% during 2022 volatility
Note: Past performance doesn't guarantee future results. Always practice proper risk management.
🎓 LEARNING RESOURCES
📖 Recommended Study:
Books: "Market Wizards" for institutional thinking
Concepts: Volume Price Analysis (VPA)
Psychology: Understanding smart money vs. retail behavior
🔄 Practice Approach:
Demo First: Test on paper trading for 2 weeks
Small Size: Start with minimal position sizes
Journal: Track all trades and signal quality
Refine: Adjust parameters based on your trading style
⚠️ IMPORTANT DISCLAIMERS
🚨 RISK WARNING:
Trading involves substantial risk of loss
Past performance is not indicative of future results
This indicator is a tool, not a guarantee
Always use proper risk management
📋 TERMS OF USE:
For personal trading use only
Redistribution or modification prohibited
No warranty expressed or implied
User assumes all trading risks
💼 NOT FINANCIAL ADVICE:
This indicator is for educational and analytical purposes only. Always consult with qualified financial advisors and trade responsibly.
🛡️ COPYRIGHT & CONTACT
Created by: Luwan (IMTangYuan)
Copyright © 2025. All Rights Reserved.
Follow the shadows, trade with the smart money.
Version 1.0 | Pine Script v5 | Compatible with all TradingView accounts

Simplified Market ForecastSimplified Market Forecast Indicator
This indicator pairs nicely with the Contrarian 100 MA and can be located here:
Overview
The "Simplified Market Forecast" (SMF) indicator is a streamlined technical analysis tool designed for traders to identify potential buy and sell opportunities based on a momentum-based oscillator. By analyzing price movements relative to a defined lookback period, SMF generates clear buy and sell signals when the oscillator crosses customizable threshold levels. This indicator is versatile, suitable for various markets (e.g., forex, stocks, cryptocurrencies), and optimized for daily timeframes, though it can be adapted to other timeframes with proper testing. Its intuitive design and visual cues make it accessible for both novice and experienced traders.
How It Works
The SMF indicator calculates a momentum oscillator based on the price’s position within a specified range over a user-defined lookback period. It then smooths this value to reduce noise and plots the result as a line in a separate lower pane. Buy and sell signals are generated when the smoothed oscillator crosses above a user-defined buy level or below a user-defined sell level, respectively. These signals are visualized as triangles either on the main chart or in the lower pane, with a table displaying the current ticker and oscillator value for quick reference.
Key Components
Momentum Oscillator: The indicator measures the price’s position relative to the highest high and lowest low over a specified period, normalized to a 0–100 scale.
Signal Generation: Buy signals occur when the oscillator crosses above the buy level (default: 15), indicating potential oversold conditions. Sell signals occur when the oscillator crosses below the sell level (default: 85), suggesting potential overbought conditions.
Visual Aids: The indicator includes customizable horizontal lines for buy and sell levels, shaded zones for clarity, and a table showing the ticker and current oscillator value.
Mathematical Concepts
Oscillator Calculation: The indicator uses the following formula to compute the raw oscillator value:
c1I = close - lowest(low, medLen)
c2I = highest(high, medLen) - lowest(low, medLen)
fastK_I = (c1I / c2I) * 100
The result is smoothed using a 5-period Simple Moving Average (SMA) to produce the final oscillator value (inter).
Signal Logic:
A buy signal is triggered when the smoothed oscillator crosses above the buy level (ta.crossover(inter, buyLevel)).
A sell signal is triggered when the smoothed oscillator crosses below the sell level (ta.crossunder(inter, sellLevel)).
Entry and Exit Rules
Buy Signal (Blue Triangle): Triggered when the oscillator crosses above the buy level (default: 15), indicating a potential oversold condition and a buying opportunity. The signal appears as a blue triangle either below the price bar (if plotted on the main chart) or at the bottom of the lower pane.
Sell Signal (White Triangle): Triggered when the oscillator crosses below the sell level (default: 85), indicating a potential overbought condition and a selling opportunity. The signal appears as a white triangle either above the price bar (if plotted on the main chart) or at the top of the lower pane.
Exit Rules: Traders can exit positions when an opposite signal occurs (e.g., exit a buy on a sell signal) or based on additional technical analysis tools (e.g., support/resistance, trendlines). Always apply proper risk management.
Recommended Usage
The SMF indicator is optimized for the daily timeframe but can be adapted to other timeframes (e.g., 1H, 4H) with careful testing. It performs best in markets with clear momentum shifts, such as trending or range-bound conditions. Traders should:
Backtest the indicator on their chosen asset and timeframe to validate signal reliability.
Combine with other indicators (e.g., moving averages, support/resistance) or price action for confirmation.
Adjust the lookback period and buy/sell levels to suit market volatility and trading style.
Customization Options
Intermediate Length: Adjust the lookback period for the oscillator calculation (default: 31 bars).
Buy/Sell Levels: Customize the threshold levels for buy (default: 15) and sell (default: 85) signals.
Colors: Modify the colors of the oscillator line, buy/sell signals, and threshold lines.
Signal Display: Toggle whether signals appear on the main chart or in the lower pane.
Visual Aids: The indicator includes dotted horizontal lines at the buy (green) and sell (red) levels, with shaded zones between 0–buy level (green) and sell level–100 (red) for clarity.
Ticker Table: A table in the top-right corner displays the current ticker and oscillator value (in percentage), with customizable colors.
Why Use This Indicator?
The "Simplified Market Forecast" indicator provides a straightforward, momentum-based approach to identifying potential reversals in overbought or oversold markets. Its clear signals, customizable settings, and visual aids make it easy to integrate into various trading strategies. Whether you’re a swing trader or a day trader, SMF offers a reliable tool to enhance decision-making and improve market timing.
Tips for Users
Test the indicator thoroughly on your chosen asset and timeframe to optimize settings.
Use in conjunction with other technical tools for stronger trade confirmation.
Adjust the buy and sell levels based on market conditions (e.g., lower levels for less volatile markets).
Monitor the ticker table for real-time oscillator values to gauge market momentum.
Happy trading with the Simplified Market Forecast indicator!

FlowScope [Hapharmonic]FlowScope: Uncover the Market's True Intent 🔬
Ever wished you could look inside the candles and see where the real action is happening? FlowScope is your microscope for the market's flow, designed to give you a powerful edge by revealing the volume distribution that price action alone can't show you.
Instead of just looking at the open, high, low, and close, FlowScope lets you dive deeper into the market's auction process. It groups candles together and builds a detailed Volume Profile for that period, showing you exactly where the trading happened and revealing the story behind the price action.
Let's explore how you can use it to gain a powerful new edge.
🧐 Core Concept: How It Works
At its heart, FlowScope does three key things:
It Groups Candles: You decide how many candles to group together. For example, setting " Group Candles " to 4 on a 5-minute chart effectively gives you a detailed 20-minute candle and profile. This helps you see the bigger picture and filter out market noise.
It Builds a Volume Profile: For each group, FlowScope analyzes the volume at every single price level. It then displays this as a horizontal histogram (we call this a "footprint" or profile). Longer bars mean more volume was traded at that price, indicating a "fair" price or an area of acceptance. Shorter bars mean price moved through quickly, indicating rejection.
It Creates a Custom "Grouped Candle": To summarize the group's overall price action, FlowScope draws a single, custom candle representing the entire group's:
Open: The open of the first candle in the group.
High: The absolute highest price reached within the group.
Low: The absolute lowest price reached within the group.
Close: The close of the last candle in the group.
This gives you a crystal-clear view of the group's net result, free from the back-and-forth noise of the individual candles inside it.
Below are some of the stunning preset color palettes you can choose from to customize your view:
🚀 How to Use: Practical Applications
FlowScope isn't just for looking pretty; it's a powerful analysis tool. Here are a few ways to integrate it into your trading:
Identify High-Volume Nodes (HVNs): Look for the longest bars in the profile. These are price levels where the market spent the most time and traded the most volume. HVNs often act as powerful "magnets" for price, becoming key areas of support and resistance.
Spot Low-Volume Nodes (LVNs): These are areas with very short bars or gaps in the profile. They represent price levels that the market moved through quickly and inefficiently. If price returns to an LVN, it's likely to move through it quickly again.
Analyze the Summary Box: This is where the real magic happens! ✨
Total Volume (Σ): The total volume for the entire group.
Buy (B) vs. Sell (S) Volume: FlowScope analyzes the lower timeframe action to estimate the buying and selling pressure that made up the total volume. Is a big red candle mostly aggressive selling, or was it just a lack of buyers? The B/S data gives you clues. A high-volume candle with nearly 50/50 buy/sell pressure might indicate absorption or a potential reversal.
Use the Grouped Candle for Clarity: Is the market in a clear uptrend, or is it just choppy? The grouped candle can give you a much clearer signal. A series of strong, green grouped candles shows much more conviction than a mix of small green and red candles.
⚙️ Settings & Customization
This is where you can truly make FlowScope your own. Let's walk through each setting.
Profile Settings
Group Candles: The number of standard chart candles you want to combine into a single FlowScope profile. A setting of 1 will analyze every single bar. A higher number gives you a broader market view. When Group Candles is set to 5, the data from the 5 individual candles are combined, and the volume is calculated accordingly.
Max Profile Boxes: This setting is more than just a number; it's a smart limit that ensures your profiles are always readable and relevant to the current market conditions.
Adaptive Sizing (The Ideal Goal): FlowScope first tries to create the perfect profile by making each volume box's height proportional to the current market volatility. It calculates an "ideal" box height based on the Average True Range ( ATR / 10 ). This is powerful because it automatically adapts: you get smaller, more detailed boxes in quiet, low-volatility markets, and larger, clearer boxes in volatile, fast-moving markets.
The Safety Cap (Your Setting): However, what if you group several candles during a massive price move? The price range could be huge! If we only used the small, ATR-based box height, you might end up with hundreds of tiny, unreadable boxes. This is where your Max Profile Boxes setting (defaulting to 50) comes in. It acts as a maximum detail cap . If the adaptive, volatility-based calculation determines that it would need more boxes than your setting (e.g., more than 50), the indicator will override it. It will then simply divide the entire price range of the group into exactly the number of boxes you specified (e.g., 50).
In short: You are setting the maximum allowable detail. FlowScope intelligently adapts the profile's granularity below that limit based on market volatility, ensuring you always get a clear and meaningful picture.
Style
Show Profile BG: A simple toggle to show or hide the faint background color behind the volume bars. Turning it off can create a cleaner look.
Color Mode: This dropdown controls how the volume profile text is colored.
Custom Gradient: This mode uses the three custom colors you select in the "Profile Colors" section to create a beautiful gradient across the profile.
Candle Color: This mode colors the profile based on whether the grouped candle was bullish (green) or bearish (red). The color will be a gradient, with the most intense color applied to the box with the highest volume; the colors of the other boxes will fade out from that point. It's a great way to see the profile's "mood" at a glance.
Profile Colors 🎨
Use Preset Palette: This is the master switch!
If checked: You can choose from 10 stunning, pre-designed color palettes from the Palette dropdown. The custom color pickers below will be disabled.
If unchecked (Default): The Palette dropdown will be disabled, and you can now choose your own three colors for the gradient.
Palette: (Only active when "Use Preset Palette" is checked) . Choose from 10 luxurious, eye-catching color schemes like "Solar Flare" or "Deep Space" to instantly change the look and feel of your chart.
Low Price / Mid Price / High Price: (Only active when "Use Preset Palette" is unchecked) . These three color pickers allow you to design your own unique gradient for the Custom Gradient color mode.
Candle Display
These settings control the custom "Grouped Candle" that summarizes the profile. When using the "Show Custom Candle" feature, you should change the chart's candlestick display to Bars for a cleaner view.
Show Custom Candle: This is the main toggle. When you check this box, the original chart candles will be hidden, and your custom FlowScope candle will be displayed instead. This custom candle is intentionally small to ensure it does not visually overlap with the volume profile boxes.
Show Body: (Only active when "Show Custom Candle" is checked) . Toggles the visibility of the candle's body.
Wick Width & Body Width: (Only active when "Show Custom Candle" is checked) . These sliders let you control the thickness of the wick and body lines to match your personal style.
Up Color / Down Color: (Only active when "Show Custom Candle" is checked) . Choose the colors for your bullish and bearish custom candles.
Experiment with the settings, find a style that works for you, and start seeing the market in a whole new light.
Happy trading! 📈😊
